Sunday, March 27, 2016

When Bad Is Good

Today's update will be very brief due to the holiday.  

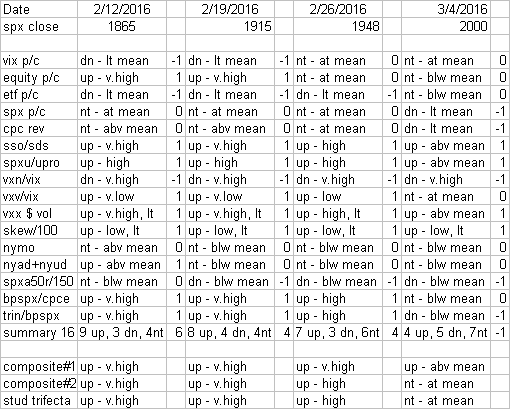
As promised I wanted to show a comparison to this weeks sentiment indicators compared to the last rally top on Nov 3, 2015.


Comparing the Nov 3 rally top to then week ending Mar 18 was identical in overall score with 0 indicators up, 9 down and 7 neutral for a rating of -7.  However, many of the negatives in Nov were more extreme, more important is that after only a 2% decline last week, the score dropped to only a -5.  Looking at the put/call ratios shows very low bearishness for both ETF and SPX P/C, while the Equity P/C reached a high enough level to become bullish, as well as turn the overall CPC to a neutral.  Changes in the put/call measure support an end of quarter rally next week mostly in the beaten down stocks (Equity P/C) with less support for the large caps (ETF and SPX P/C).

As for the title "When Bad Is Good",  I am referring to the extreme overbought condition of some of the indicators that can actually be a sign of strength - at least short term.  Similar to the Zweig breadth thrust off the Aug 2015 lows that convinced many that a bull market rally to ATH was around the corner, we now have extreme readings in the NYMO and the cumulative NYSI that did not occur in either the 2000-02 or the 2008-09 bear markets.  A strong rally in the DJIA late 2000 into 2001 could be view as similar but weaker.

Another indicator the VXV/VIX, whose 20 day SMA normally oscillates between 1.00 and 1.20, reached a level of 1.22 last week.  This last occurred at the Dec  2014 and Mar 2015 tops on the markets way to ATHs last May.  The extreme overbought conditions may keep the market afloat for another two or three months as in 2015, but there is no doubt that Cinderella's coach will turn into a pumpkin sooner or later.

Saturday, March 19, 2016

A Top is Very Near

On March 5 using  the Students Trifecta Model (VXV/VIX, SPXA50R/SPXA150R, and TRIN/BPSPX), as representative of the overall sentiment picture ... 

I pointed out that
"Bearish sentiment has now declined to about the same level for the SPX as in Oct 2015 when the SPX was about at 2010. At that point we were about three weeks from the Nov top at 2116, So it is possible on sentiment comparisons that we reach SPX 2100, but it is more likely that a top is reached in the 2050-2080 range."  With 2080 the ideal target.

Now, two weeks later, we appear to be only days away from a top with 2080 still the ideal target.


In addition the individual indicators have turned overwhelmingly bearish, the overall reading has gone from +6 net positive on Feb 12 to -10 net negative as of Mar 18, and all three of the composites have turned negative as well.


However, we are likely to see a two month distribution or topping process similar to Nov and Dec of 2015, roughly between 1980 and 2080, before further downside.  The volatility measures VIX put/call and VXX $ volume will likely be the last measures to turn bearish.

Edit: March 22, The reading for SDS/SSO should have been neutral, changing the overall score to a net of -9.  This will be corrected for future reports.  Comparison to Nov 3. 2015 top next weekend.

Sunday, March 6, 2016

Indicator Scorecard as of March 4, 2016

Not sure of the value, but I wanted to start tracking individual indicator performance.  Rating is a little subjective since I look at past performance to evaluate. Down (dn), up, and neutral (nt) indicate market bias.  Measures are for bearish sentiment so a high value may be considered low bearish sentiment and vice versa.


Saturday, March 5, 2016

Sentiment is Becoming Less Bullish

This weekend I will be reviewing the Students Trifecta Model (VXV/VIX, SPXA50R/SPXA150R, and TRIN/BPSPX), including instructions on how to create charts for the components using Stockcharts.com, as well as a number of the short/long ETF pairs (ie, "synthetic" put/call ratios).

The current Students Trifecta is representative of the overall sentiment picture as shown below.  Bearish sentiment has now declined to about the same level for the SPX as in Oct 2015 when the SPX was about at 2010.  At that point we were about three weeks from the Nov top at 2116,  So it is possible on sentiment comparisons that we reach SPX 2100. but it is more likely that a top is reached in the 2050-2080 range.  The SPX 2080 target has nice symmetry for a bear market scenario since it is the 78% retracement for wave A down, and if C = A then the next target lower is 1760, my target for a "summer swoon".

Looking at the individual components, two are available intraday (VXV/VIX and TRIN/BPSPX) for those that want to check sentiment readings during market hours.  All three components are tracking the Oct 2015 rally very closely, so hopefully will warn of a top when similar readings are reached. When using Stockcharts.com, each variable is preceded by a "$" with the divide "/" replaced by the ":".  For example, the VIX term structure VXV/VIX is input as $VXV:$VIX.

For all charts under chart attributes I use dashed lines for daily data and check log scale, under indicators I use Price, $SPX and behind price.  For the VIX term structure, I use a 1 year period/daily and under overlays use a 10 day SMA and horizontal lines at 1 and 1.2, where the top is usually when the 10 MA nears 1.2. For the TRIN/BPSPX, I use a 6 month/daily period with a 20 day SMA and this produces a nice sentiment chart with lows at tops and highs at bottoms.  For the overbought/oversold indicator (SPXA50R/SPXA150R), I use a 1 year/daily period with a 20 day SMA and horizontal lines at .65 and .95.  One last note before saving the chart link, below the chart click Permalink, Reload with link to create the final link.

The amazing thing about these indicators is how closely they are tracking the Oct 2015 rally with each at comparable positions to about 70% completed or about SPX 2080 for a top.

Finally, I want to show updated ETF-based sentiment for the SPX, NDX, RUT and HUI.


Using the SPXU/UPRO to measure sentiment for the SPX, you can see that sentiment is comparable to Oct 2015 when the SPX was at 2010 similar to the Students Trifecta.


Using the SQQQ/TQQQ for the NDX, we can see higher bearish sentiment for the NDX than the SPX, so the NDX is expected to outperform for the remainder of the rally.


Using the TZA/TNA for the RUT, we see that bearish sentiment is below average, indicating weaker expected performance compared to the SPX.


Finally for the HUI using DUST/NUGT, we see that sentiment has reached lower extremes, but is likely to remain in a trading range from 150 to 200 for the next few months similar to the first half of 2015.