Saturday, September 30, 2017

Scary October or Something Else?

Surprisingly sentiment is relatively unchanged for the week although the SPY was finally able to overcome the 250 level last week.  Two weeks ago in the quarterly preview this level was identified as critical to mark the beginning of the "meltup" phase.  Longer term, I am getting a deja vu feeling to Q4 of 2015 when after surviving October, most of the EW analysts turned super bullish expecting the SPX to reach 2300 to 2400 early in 2016, while I was warning of a 10% correction as early as Nov.

I. Sentiment Indicators

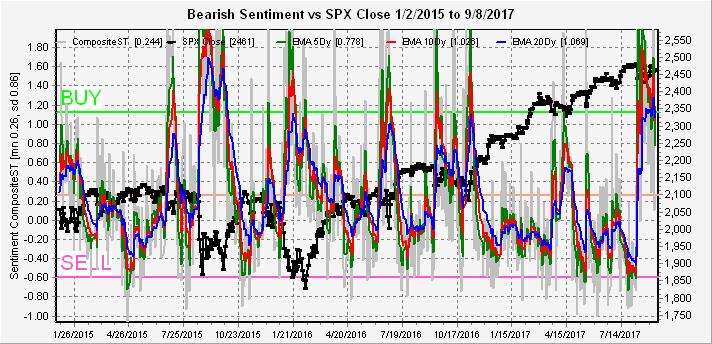
The overall Indicator Scoreboard continued its sideways dance as the bears are probably pinning their last hopes on scary Oct.


The Short Term Indicator (VXX $ volume and Smart Beta P/C) rose very slightly even as the markets made an upside breakout, the perfect scenario for climbing the wall of worry.


The VXX $ volume continues its dance around the mean.  With its $ vol averaging $.9B, a drop of about 30% is required for an equivalent level to late 2015.  This means the current price of $39-40 needs to fall to $27-8 or vol at 22M needs to fall to 15M or some combination of both.


Moving on to bonds (TNX) bearish sentiment has started to move up short term, but the longer term outlook remains bearish for bonds.


For the gold miners (HUI), traders seem completely unfazed by the HUI giving up half its gains since early July and this could lead to a scary Oct.


And for one sector (RUT) that has gone completely bananas, although there may still be some unresolved adjustment required for the May 1 split in the TNA.


II. Options & Open Interest

First looking at an update for the VIX Call Indicator, we did get the sharp run up I was looking for with most of the volume on Mon as posted on Twitter.  Remember that SELLs have a 1 to 3 week lead and may be tied to the upcoming NK holidays, expected to be a missile fest on Oct 10 and 18.  I added a new section in the Investment Diary, an Indicator Primer mostly for new readers, that starts with a write up of how/why I think the VIX Call Indicator works.


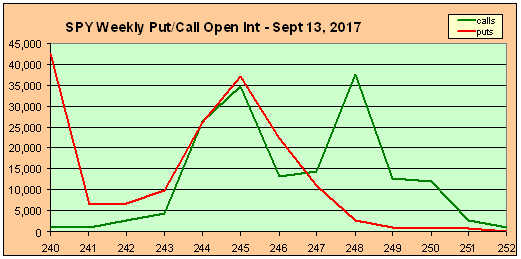
Moving on to the options open int charts for the SPY, last week I indicated a target of 251 (act 251.2) on a positive reaction to the tax proposal. Now putting the SPY firmly in the positive delta hedging area.


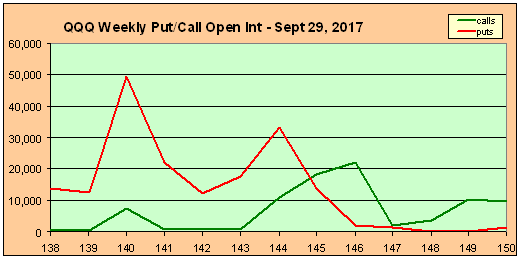
But first a warning on delta hedging, shortly after I started following OI in May, the NDX/QQQ was on a tear with positive delta hedging but during opex week dropped from 139.5 to 136 in one day, stopped only by the larger OI in June.


Back to the present.  For next Wed, once past SPY 250 there is little resistance above.


But Fri shows pretty stiff resistance at SPY 252, so this may be a range bound week.


For the week of Oct 13, there is strong resistance at SPY 255 with little support until 246.


For opex week, we see something very similar to the QQQ chart for opex May shown above.  Combined with the VIX Indicator SELL last week, this is a strong warning to look out for a possible drop to SPY 246 this week if a previous high of 254+ (SPX 2550) is attained.  As with the NDX in May, however, this may not be the ultimate high.


Conclusions.  The VIX Indicator SELL last week is pointing to at least a short term disruption in the next 1 to 3 weeks.  Currently, overall sentiment does not point to a lasting top.  The market may continue higher into mid month Oct to SPX 2550, but opex week could be very volatile.

Weekly Trade Alert.  Nothing this week, should have been buying puts on VXX.  Updates @mrktsignals.

Investment Diary, update 2017.10.xx, (in progress) Indicator Primer
Article Index 2017 by Topic
Article Index 2016 by Topic

© 2017 SentimentSignals.blogspot.com

Saturday, September 23, 2017

More Volatility Compression Ahead

Over the past few weeks I have pointed out how extreme bearish sentiment in the ST Indicator components, VXX $ Volume and Smart Beta PC, supported higher stock prices, but that the money flow measures using ETF short/long comparisons were still heavily long, limiting potential gains.  My conclusion was that a lengthly consolidation (thru Oct) in the upper part of the trading range (SPX 2450-2500) was likely.  Today the SPX seems to have found a home around the 2500 level and while the ETF measures are approaching the SELL level (limited upside), the ST indicators have only retraced to the mean (more time required).

I. Sentiment Indicators

Today, I am taking a long term look (back to 2015) for all sentiment indicators as my long term view is that removal of the extraordinary central bank support for the economy will have long term effects on most of the markets.  Think 1970s with deflation instead of inflation.

The overall Indicator Scoreboard saw a slight bounce in the shorter EMAs with concern over the FOMC, but longer term still working downwards.


The Short Term Indicator (VXX $ volume and Smart Beta P/C) also leveled off short term, indicating that higher prices may be required as we saw in April of 2015.


The VXX $ volume continues to amaze me as the bears seem to have focused on the record lows in the VIX with dreams of a potential rise to the 50 to 100 level.  Unless an improvement is seen here, we may see the topping process stretch out for months.  This does support the idea of a 1970-72 bear market longer term where it took two years for prices to fall 20%, think of two years where every 6-8 weeks we had a 3% decline followed by a 2% rally (much like the reverse of 2017).


Using the Short/Long ETFs for both SPX and NDX we can see that there is little money flow support for higher prices (pointing to limited upside) as both traders (SPXU/UPRO, and TQQQ/SQQQ) and investors (SDS/SSO and QID/QLD) are mostly all in.


Moving on to bonds (TNX) bearish sentiment is nearing the overall levels of mid 2016 which were followed by a sharp rise in rates.


For the gold miners (HUI), the longer term outlook is not much better than bonds.


II. Options & Open Interest

First looking at an update for the VIX Call Indicator, we saw an increase prior to the FOMC, but overall the increase from the lows is about .3 with a SELL at .5.  SELLs usually have a 1 to 3 week lead so mid or late Oct still looks probable for a top.


Last week showed one of the problems with relying too much on the options open interest as prices were not as weak as suggested.  This is why I recommend the use similar to support resistance zones or as EW pivots with overall sentiment determining strength or weakness.  There was, however, another instance of the "new put" phenomenon as outlined in the  Investment Diary, update 2017.09.05, (formerly Short Term Trading Observations) when new puts were added to the SPY Wed 22nd open int Mon/Tue and Wed AM saw a high P/C ratio as mentioned in Twitter, but I should have said SPY 248-9 (act 248.9) since I forgot the 1.2 drop in SPY from going ex-div.  As a reader commented, updates for the open int are available from Opricot with the low pt of the 3rd chart the most likely pin.

Looking at the options open int charts for next week for the SPY, Wed looks like more of the same with a most likely pin at 249.5 (SPX 2503), but open int is very light.


For Fri, the open int for calls swamps puts and should push prices below SPY 248 and could possibly lead to a fill of the gap in the SPX at 2462.  However, Wed is supposed to see a prelim release of the Rep tax plan, so will there be a big disappointment or will ST sentiment keep prices elevated with a possible push to SPY 251?


Conclusions.  Again a lack of clarity with overall money flow sentiment pointing to a nearing top but with the ST indicators saying not quite yet.  As I pointed out in the past, I have never seen this much enthusiasm for the vol products in a stable market, and the effect on prices is hard to determine.  Several indications are that the Rep tax plan may take months to work out, so that may continue to support high stock prices longer than reasonable.

Weekly Trade Alert.  Options open int point to a pullback late in the week, but the VIX Call Indicator is unlikely to give a SELL unless Mon-Wed call vol averages 900k+.  Also watch for "new puts" as a possible sign.  Updates @mrktsignals.

Investment Diary, update 2017.09.05, "new put" support is bearish
Article Index 2017 by Topic
Article Index 2016 by Topic

© 2017 SentimentSignals.blogspot.com

Saturday, September 16, 2017

Will the Stock Market Ever Go Down?

If you are like me, you must be wondering if sentiment will ever show the potential for a sustained correction. This week as I take a three month look ahead for the options open interest, the results may surprise you. Also this week I will show an update for the VIX Call Indicator and a back test for the mid-2015 topping period.

I. Sentiment Indicators

Looking back to 2015 for the SPX indicators, the overall Indicator Scoreboard shows a sharp drop in bearish sentiment with the st EMA (green) approaching the SELL area, but the lt EMA (blue) expected to drop to the -7/8 area seen in late Oct 2015 and late Apr 2016 before a downturn.


The Short Term Indicator (VXX $ volume and Smart Beta P/C) has also dropped sharply and comparing the run up in sentiment to the Aug 2015 flash crash of 200+ SPX pts, it is now at a level comparable to late Oct 2015, or about 50 SPX pts from the rally high.


Looking more closely at the ST Indicator components, for the Smart Beta P/C) the 5 dy EMA (green) should give a SELL with the  20 dy EMA (blue) reaching .55-.60 before a SPX top is reached.


With the VXX $ volume an EMA decline for the 5 dy to .70 and for the 20 dy to.80 is expected before an SPX top.


Looking at the SPX ETFs SPXU/UPRO we are nearing levels of other 2017 tops with increasing likelihood that a major top is near due to the duration of time close to the SELL level.


Moving on to bonds (TNX) bearish sentiment triggered a SELL when rates dropped near the 2.0% level, indicating that a significant change in trend may be occurring as the decline since the beginning of the year has retraced about 38% of the run up in rates from July thru Dec of 2016.


For the gold miners (HUI), sentiment remains moderately positive with the EMAs hovering around .80.


II. Options & Open Interest

First, I want to look at the VIX Call Indicator today and for mid-2015, then look at the SPY and VIX open interest for Oct, Nov and Dec.  Below you can see that the VIX Call Indicator has flattened out near 0.1 as the SPX rallied over its 20 dy SMA.  We saw the same pattern in early Feb as the SPX rallied for another month into the early Mar high which produced a VIX Call Sell signal.


As a back test for the VIX Call Indicator, this shows the mid-2015 topping pattern from early May thru Aug 19 (day before flash crash).  Here, there were no Buys (dumb money buying at bottoms), but otherwise nailed three of four tops (rise of .5 or 50% of mean), only missing the  late July decline with a rise of only .4 or 40% of mean.


Moving on to the options open interest, for the quarterly outlook I will start with the VIX since that gave us strong warning of the Aug decline.  The most likely for Oct 18 would normally be 13-14 but since we have already reached 10, negative delta hedging from the puts at 11 & 12 are likely to keep the VIX low.


For Nov 15, the smaller number of puts could allow the VIX to rise, but would probably be limited to the 13-15 range.


For Dec 20, we see that puts may pressure the VIX up to 15, but calls offer strong resistance at that level. So overall, a moderate rise in the VIX seems likely thru Dec, but not as sharp as in Aug.


Looking at the SPY monthlies, the larger number of calls between 250 and 255 should pressure the SPY downward toward 247/8, but once over 250 positive delta hedging is likely to push prices upward to the 254/5 level.  SPY 250 is somewhat easier to reach due to the large number of puts there,


For Nov 17, the large number of calls at SPY 250 and over relative to puts is likely to push prices below 250 with most likely at 248/9 and 246 possible.


For Dec 15, the range between SPY 246-49 is most likely, but the large position of puts and calls at 245 may end up creating a negative delta hedging situation opposite of the 250 area for Oct - if that happens a drop to 241-3 seems likely.


The short term outlook for the SPY is bimodal due to the possible positive delta hedging over 250 that would likely keep prices higher, so the following only works if price drops below SPY 250.

For Wed, the most likely is SPY 249.


For Fri 22nd, a move to 248/9 is likely.


For Fri 29th, a move below 248 is likely and could fill the gap at 246.


Conclusions.  I am going to focus on the quarterly outlook since the short term is somewhat ambiguous. Overall sentiment has declined considerably from the extremes of a few weeks ago, but does not indicate a top is in place.  The ST indicator is consistent with an additional rally of SPX 40-50 pts as is the Oct SPY options OI.  The VIX Call Indicator is also similar to early 2017 which was followed by a month long rally before generating a Sell.  Together sentiment is consistent with a rally to SPX 2540-50 by mid-Oct.  The VIX options OI for Nov-Dec shows a possible rise to 15ish, while the SPY options OI indicate that Nov and Dec could see a decline to the low SPX 2400's.  Together the options OI point to a weak end of year for the SPX but not a lot of volatility, while the SPX ETFs SPXU/UPRO warn that there may be a major top in Oct.

Weekly Trade Alert.  Last week was somewhat stronger than expected, but given the previous week's drop to fill a gap at SPX 2458 went to 2445, on Mon's Twitter update before the open I posted a 2486/7 target for Wed and Tues after close indicated the possibility of a meltup.  We could be preparing for a repeat of BitCoins rise from 4000 to 5000 and reversal in the SPX.  Not worth the risk of trading to the upside, wait for VIX Call Sell to Short.  Updates @mrktsignals.

Short Term Trading Observations, update 2017.09.05, "new put" support is bearish

Article Index 2017 by Topic
Article Index 2016 by Topic

© 2017 SentimentSignals.blogspot.com

Saturday, September 9, 2017

Chasing Unicorns

Market prices were slightly lower than expected last week, but very much in line with the trading range expected. Unfortunately, both bulls and bears may be chasing unicorns if they expect much difference since the outlook for the rest of September is more of the same.  Today I am adding a new section in the appendix on short term trading observations for discussions on topics for trading tips that are too long for Twitter.

I. Sentiment Indicators

For the main indicators, I am going to continue to show back to 2015.  The overall Indicator Scoreboard continues to hover near neutral with little pressure to push prices higher.


The Short Term Indicator (VXX $ volume and Smart Beta P/C) still remains highly elevated with the result of placing a floor under prices for a market that seems to be faced with endless reasons to go down.


Today I want to take a short term view of an indicator that has recently done a good job of anticipating price moves, the SKEW.  From 2014 thru 2016 the SKEW seemed to work as a "price change" indicator, where large changes, both up and down, occurred when at high levels, but in 2017 has been more of a trend indicator.  As a confirming indicator, BUY and SELL levels are reversed.  High levels of the SKEW (140) have done a good job of anticipating declines, while low levels (130) have anticipated up trends.  Current levels are neutral with the direction indicating an up trend (pullbacks will be minor).


Moving on to bonds (TNX) bearish sentiment remains at fairly low levels as rates continue to decline while the seemingly endless list of perils are driving rates down, even though the stock market seems not to notice.


For the gold miners (HUI), sentiment remains moderately positive.


II. Options Open Interest

This week I will look at the SPY and QQQ thru EOM since the NDX/QQQ seems to be the main source of volatility.  First for Wed, the SPY current price (246.6) is at the most likely pin so any early moves are likely to be reversed by Wed.


For exp Fri, the SPY most likely pin is just below 245, which would be SPX 2445, but the range of 244-6 is open.


For the week of Sept 20, SPY a move to the 245 to 246 area seems likely with strong resistance at 248.


For the week of Sept 29, SPY resistance moves up to 249, so 247 or slightly higher seems likely.


Looking at the NDX/QQQ for exp Fri, the current close (144.2) is most likely so any moves up or down are likely to be reversed.


For Sept 29, support is very strong below 145, so 146 or higher is possible with 145 most likely.


Conclusions.  Last weeks outlook for an extended trading range mostly between SPX 2450-2500 got off to a good start, even with a spike low to 2445.  More of the same seems likely thru the EOM.  I wonder if Trump pulled an end around with the Dems by agreeing to put off the debt ceiling decision since this leaves the Reps free to concentrate on the tax cut proposal.

Weekly Trade Alert.  Still a very boring outlook.  SPX may hit gap at 2476 on relief rally (SELL) if Florida survives Irma and Nuke Korea doesn't threaten anyone over the weekend with SPX 2450 or lower likely by EOW.  Updates @mrktsignals.

Short Term Trading Observations, update 2017.09.05, "new put" support is bearish

Article Index 2017 by Topic
Article Index 2016 by Topic

© 2017 SentimentSignals.blogspot.com