Saturday, December 26, 2020

Something has to Change

Wishing everyone a happy and covid-free holiday season and a prosperous new year.  This weeks report will be somewhat shorter than normal as well as the time frames, looking only at the past year as the year draws to a close.

The first thing that jumps out when looking at the SPX is that prices seem to be following the rounded top scenario, similar to mid-2015, as mentioned as a possibility several weeks ago.  Many are looking at this as an ending diagonal with an imminent breakdown, likely targeting the 3500 area.  Springheel Jack discusses this option from an EW view.  SPX options OI still shows this as a possibility by Dec 31, but time is running out.

The Tech/Other section takes a look at the Tech Indicator Composite and the VIX Buy/Sell Indicator, now approaching an INT VIX Buy/SPX Sell.


I. Sentiment Indicators

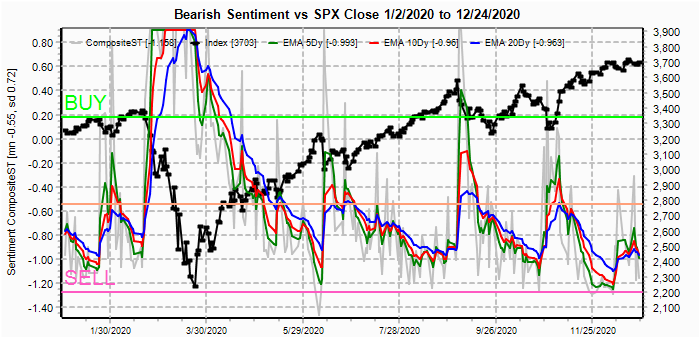
The overall Indicator Scoreboard (INT term, outlook two to four months) bearish sentiment over the past six months looks like an elongated version of of the Jan-Feb topping process, inching higher last week.


The INT view of the Short Term Indicator (VXX $ volume and Smart Beta P/C [ETF Puts/Equity Calls], outlook two to four months) bearish sentiment may have bottomed early Dec similar to Jan.


Bonds (TNX).  Bearish sentiment in bonds from a ST perspective have been following the moves in rates closely.


For the INT outlook with LT still negative, the gold miners (HUI) bearish sentiment is somewhat more confusing as the peak was at price lows in Mar but at price highs in Aug.  Current levels are close to neutral.


II. Dumb Money/Smart Money Indicators

The option-based Dumb Money/Smart Money Indicator as short/INT term (outlook 2 to 4 mns/weeks) bearish sentiment for both option indicators also look like a longer version of the Jan-Feb topping period, last week dropping down to the level seen prior to the mid-Dec drop down to the SPX 3630s.
.


And the sister options Hedge Ratio bearish sentiment is also hovering at levels seen at the Feb highs.


III. Options Open Interest

Using Thur closing OI, remember that further out time frames are more likely to change over time, and that closing prices are more likely to be effected. Delta hedging may occur as reinforcement, negative when put support is broken or positive when call resistance is exceeded.  This week I will look out thru Dec 31. Also, this week includes a look at the TLT for Jan exp. 

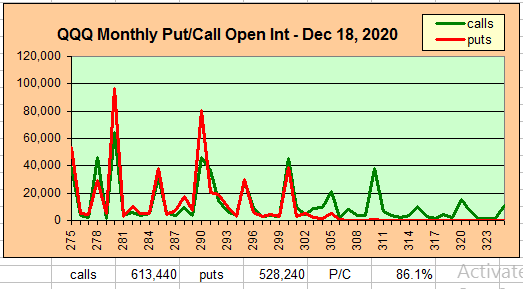
Mon SPX drop of 100 pts at the open was probably a strong factor, but there have been a lot of ST puts added with Thur P/C going from 102% a week ago to 202% This w/ about 40k calls and 130k puts added during the week. As a result, this weeks P/C may be understated. I will try to update during the week.

With Fri close at SPX 3703, options OI for Mon shows moderate call resistance at 3725 and 3750 with put support starting at 3665.  Possible downside bias.


Wed has similar OI where SPX put support starts at 3650 and call resistance at 3700 and 3725.


For Thur EOM, now showing large put support at SPX 3500 and smaller between 3600-50 (likely will change during week) with call resistance at 3675 and 3700.  The potential still exist for a sharp drop to the low 3500s due to negative delta hedging.


Using the GDX as a gold miner proxy closing at 36 is down slightly for the week from 36.5 after dropping to 35.

Currently the TLT is 157.3 with the TNX at 0.93%, and is unchanged for the week after dropping to 155.5 and may be pushed up to 158 with positive delta hedging.


IV. Technical / Other

The technical indicator Composite (NYMO+TRIN+NYAD+NYUD) is somewhat interesting, for one we have now reached the neutral level after an extreme low similar to Jan (see Nov 21 for LT), and two the last four lows have alternated between marking the exact top for June and Oct, while leading by about a month with lows in mid-Aug and early Dec.  Does this mean a decline starting mid-Jan?


The VIX Buy/Sell Indicator (VXV/VIX & SKEW) is more of an INT indicator, specifically to forecast a rise in the VIX, and at -1 SD is at the same level as Jan and May 2018, although -1.5 is considered an official Sell.  The last Sell in Aug, prior to the Sept & Oct declines only resulted in an 8% decline in the SPX. but the VIX did reach 40, the same level as in Dec 2018.


Conclusions.   A significant top is approaching, the only question is when.  The last three years (prior posts) have shown megaphone patterns in both sentiment and prices where sharp declines have resulted in extreme high bearish sentiment, only to be followed by more extreme rallies and extreme low bearish sentiment.  This must end some time, perhaps this was just the result of Trump's policy of creative destruction where his policy of creating havoc forced the Fed to be more active.

Next year, I see a significant change with a more stable administration, but likely the beginning of a 1.5 to 2 year bear market with increasing risk in the second half of 2021, possibly due to higher taxes and more regulation, especially for large techs.

Weekly Trade Alert.  Time appears to be running out for EOM options gamma event to test the low SPX 3500s, but the VIX Buy/Sell indicator is telling us that this is more of pay me now or pay me more later situation.  Also, the rounded top implies limited upside and downside, probably inuo mid-Jan.  Updates  @mrktsignals

Investment DiaryIndicator Primer,
 update 2020.02.07 Data Mining Indicators,
 update 2019.04.27 Stock Buybacks,
 update 2018.03.28 Dumb Money/Smart Money Indicators

Saturday, December 19, 2020

Is a Gridlock a Good Thing?

After watching the seemingly never-ending bickering over a second round of post-Covid stimulus between the Senate and the House, I am beginning to wonder if this will not be the "cause" of the next bear market in stocks.   Typically when the economy is strong as in the first 3 years of the reign of Trump, DC gridlock is a good thing, but when the economy is floundering as it has been doing post-Covid, strong leadership may be essential to steer the economy forward.  The lack of strong leadership under Trump (denial that problems even exist, first covid and lately cybersecurity) are the reason the US is lagging the recovery seen in many other countries.

For the week expectations were that the SPX would push upwards to new ATHs for Dec Optn exp with the potential for a pop & drop toward the EOM to the low 3500s.  Mon opened down, reaching 3650 before a reversal began pushing the SPX up to a 3727 ATH before a drop to 3686.  Early Fri AM I warned in the update that with the focus on a new stimulus package that may not be the final high with talks dragging on onto the weekend, and with OI put support at 3700 a strong rally the last few minutes pushed prices back over 3700. Next weeks SPX options OI show that more strength is possible Mon/Tue, but weakness may return Wed/Thu.


I. Sentiment Indicators

The overall Indicator Scoreboard (INT term, outlook two to four months) bearish sentiment was relatively unchanged for the week.


The INT view of the Short Term Indicator (VXX $ volume and Smart Beta P/C [ETF Puts/Equity Calls], outlook two to four months) bearish sentiment increased slightly as a pickup in intra day volatility resulted in an increase in the VXX $ Vol below.


The VXX $ Vol increased slightly due to the 50 and 40 pt swings in the SPX seen on Mon and Fri.


Bonds (TNX).  Bearish sentiment in bonds is slowly edging higher following rates higher.


For the INT outlook with LT still negative, the gold miners (HUI) bearish sentiment rose moderately, even though prices rose for the week.


II. Dumb Money/Smart Money Indicators

The option-based Dumb Money/Smart Money Indicator as short/INT term (outlook 2 to 4 mns/weeks) bearish sentiment spiked higher early in the week then fell back to unchanged.


And the sister options Hedge Ratio bearish sentiment fell for the week, remaining at levels conducive to moderate corrections.


The INT term SPX Long Term (2x/DM) ETFs (outlook two to four weeks) bearish sentiment remains near levels seen at other corrections.


The INT term NDX Long Term (2x/DM) ETFs (outlook two to four weeks) bearish sentiment has now fallen to the lowest levels seen since Mar, slightly below the levels at the Feb top.  Although not the lowest levels of the past three years, sentiment is now about the same as the Sept-Oct 2018 top.


III. Options Open Interest

Using Thur closing OI, remember that further out time frames are more likely to change over time, and that closing prices are more likely to be effected. Delta hedging may occur as reinforcement, negative when put support is broken or positive when call resistance is exceeded.  This week I will look out thru Dec 18. Also, this week includes a look at the GDX for Jan exp. 

With Fri close at SPX 3709, options OI for Mon are small with a large spread at 3700 that may keep prices near that level, but there is little put support at lower levels and no large call resistance until 3800, so a large intra day range is possible.


Wed has very small OI except for large put support at at SPX 3450.  Essentially anything is possible.


For Thur (closed Xmas Fri), SPX OI is somewhat larger with a negative bias toward 3650-3700.


For Dec EOM, still little put support above 3600 with the large call OI at 3510 & 15 likely to create a negative event.


For the QQQ (NDX/41, 12.3k=300), closing at 310/12,738, show a negative bias toward 300 with strong support at 290.


Using the GDX as a gold miner proxy closing at 36.6 shows large call resistance at & above 38 with weak put support starting at 35.


Currently the TLT is 156.4 with the TNX at 0.95%, . 


IV. Technical Other - N/A

Conclusions. There were some interesting and conflicting analyst projections last week as B of A's M. Harnett's post on ZH was that the B of A composite model had reached the official sell level matching the last sell Feb 2020, while the well-known market timer Tom DeMark came out with a prediction that the  SPX was headed for 3907 the next few weeks before a top.  DeMark's last referenced call was in July after the June drop of about 250 pts (200 in one day), also calling for a strong rally, which was correct, however, sentiment was much more bearish.  It is possible that a similar sharp drop from SPX 3750ish to 3500 could also create strong bearish sentiment resulting in a strong rally in Jan, possible if the GOP wins the Georgia Senate runoffs and the market celebrates a "last hurrah" for gridlock.

Weekly Trade Alert. Same as last week. Either a "sell the news" if stimulus approved, or "loss of hope" if not approved by Wed/Thu, will likely see a "pop & drop" from about SPX 3750 to low 3500s.  Updates @mrktsignals.

Investment DiaryIndicator Primer,
 update 2020.02.07 Data Mining Indicators,
 update 2019.04.27 Stock Buybacks,
 update 2018.03.28 Dumb Money/Smart Money Indicators

Saturday, December 12, 2020

Is the Election Finally Over?

I had been planning on using "USA vs USTrump" as a title for this week, but the Supreme Court decision late Fri killed that.  I wasn't surprised at the outcome, but the 7-2 margin was a surprise.  I guess Trump doesn't have as many friends in high places as he does in the redneck bars in his Red states.

The SCOTUS decision and the FDA approval of Pfizer's covid vaccine late Fri combined with the high SPX options OI Mon/Wed are likely to propel the SPX back to 3700+ (possibly as high as 3750) the first half of the week, but a pop & drop can occur any time after the FOMC report on Wed.  Ideally, I would like to see a repeat of the Sept-Oct 2018 highs.  This would imply a high options exp, with a drop starting by the end of day continuing into the EOM to the SPX 3500-25 area and a high retest the first half of Jan 2021.

In last weeks Tech/Other section, i showed the Rydex Bear/Bull ETF rato that indicated an immediate INT top was not likely and this week I will look at a couple of VIX measures that show similar results as well as a couple of SPX ETF indicators.


I. Sentiment Indicators

The overall Indicator Scoreboard (INT term, outlook two to four months) bearish sentiment is mostly unchanged for the week remaining at the lowest levels of the last two years.


The INT view of the Short Term Indicator (VXX $ volume and Smart Beta P/C [ETF Puts/Equity Calls], outlook two to four months) bearish sentiment remains in dangerous territory.


The VXX $ Vol fell sharply early in the week, then rebounded with the Thur/Fri pullback.


Bonds (TNX).  Bearish sentiment in bonds continues in a tight range with a slight upward trend, following rates higher.


For the INT outlook with LT still negative, the gold miners (HUI) bearish sentiment rose slightly as prices consolidated around the lower TL at 300.


II. Dumb Money/Smart Money Indicators

The option-based Dumb Money/Smart Money Indicator as short/INT term (outlook 2 to 4 mns/weeks) bearish sentiment .


And the sister options Hedge Ratio bearish sentiment .


The INT term SPX Long Term (2x/DM) ETFs (outlook two to four weeks) bearish sentiment .


The INT term NDX Long Term (2x/DM) ETFs (outlook two to four weeks) bearish sentiment (no chart. see QQQ OI).


III. Options Open Interest

Using Thur closing OI, remember that further out time frames are more likely to change over time, and that closing prices are more likely to be effected. Delta hedging may occur as reinforcement, negative when put support is broken or positive when call resistance is exceeded.  This week I will look out thru Dec 18 plus 31. Also, this week includes a look at the TLT for Dec exp. 

With Fri close at SPX 3663, options OI for Mon show strong put support at 3650 with only small call resistance up to 3700 and above.  With SCOTUS throwing out Trumps last claim to fame and the FDA approval of the Pfizer vaccine late Fri. we could see a test of the ATH Mon/Tue.


Wed has modest OI where SPX shows support at 3600 and resistance at 3700 & 3735.  Could be a setup for an FOMC pop & drop.


For Fri AM, I usually don't show the AM since the OI are largely hedged, but the small P/C may give a negative bias toward SPX 3600.


For Fri PM, SPX OI has a lot of overlap with 3550 to 3700 a possible range.  Much will depend on rollover of put support from Mon/Wed.


For Dec EOM, SPX OI continues to show 67k calls at 3515&25 for potential negative gamma.


For the QQQ (NDX/41, 12k=293), closing at 301.8/NDX 12,375, strong support remains at 290 and resistance is probably understated due to large equity call vol (mainly FAMNGS + Tesla).


Using the GDX as a gold miner proxy closing at 35.1, GDX was down slightly remaining in a tight range around the OI neutral area at 35.

Currently the TLT is 158.8 with the TNX at 0.89%, with modest support/resistance at 155/160.5 up from last weeks 155 level and could move to 160+. 


IV. Technical Other

This week I want to take a look at several of the data mining indicators.  First, looking at the VIX Buy/Sell indicator (VIX term structure + SKEW) as a base for the VIX calls and puts.  Second, the SPX ETF indicators SSO to CPCREV and SSO to ETF calls.

Somewhat similar to comparing rhe level of equity puts and calls to the Equity P/C ratio to measure extremes, comparing VIX puts and calls to the VIX Buy/Sell indicator has worked faily well as shown below.  The low level of call buying seen currently is modestly positive.


Likewise, for VIX puts, a high level compared to the VIX Buy/Sell is a SELL and is currently neutral.


For the SPX ETF indicators, the SSO/SPX term sructure (SSO to CPCREV) is coming off an extreme similar to the Sept and Oct tops.


While the SSO/SPX hedge ratio (SSO to ETF calls) is only modestly negative, so a crash is not expected (outside an external shock similar to the covid breakout).


Conclusions.   Last week's call for a modest pullback to about SPX 3650 turned out to be mostly correct as initial decline to 3660 was followed by a new high to 3715 then a move down to the 3630s, closing down about 1% at 3663.  Next a rally should follow into opt exp Fri of 2-3% likely encouraged by Trump failure to scuttle the election via the Supreme Court and approval of Pfizer's vaccine.  Given the extreme low bearish sentiment of the last six months coupled with still moderate hedging, I am still looking for a longer term bear market than we've seen the last three years, possibly extending into 2022 with an initial down leg in Jan-Feb 2021 and a final downside target of 35-40% or SPX 2000-2200.


Weekly Trade Alert.  Be on the lookout for a pop & drop from the SPX 3700+ area in hte late Wed-Fri timeframe with a target lows in the 3500-25 area by EOM.  Updates  @mrktsignals.

Investment DiaryIndicator Primer,
 update 2020.02.07 Data Mining Indicators,
 update 2019.04.27 Stock Buybacks,
 update 2018.03.28 Dumb Money/Smart Money Indicators

Saturday, December 5, 2020

High on Fedphoria

Last week the SPX moved about 1% higher than originally expected, although the Thur AM OI update indicated that there was strong put support and little call resistance up to 3700.  At some point there is little reason for higher prices and we seem to be near that level.  There have been several notable tops around the quarterly options exp, including Sept 2018 and more recently June 2020.  This month we have the electoral college vote for POTUS on the 14th, the FOMC on 14th&15th, and options exp on the 18th, so a good chance for some fireworks and/or a high vol distribution top.  In June, the SPX dropped 200 pts the last two weeks of the month and with the high SPX call OI for Dec 31 just above 3500, we may see a repeat.

The Tech/Other section takes a look at the Rydex Bear/Bear ETF indicator which nailed the last three INT tops and the data mining Equity P/C indicators showing comparable extremes seen at the recent Sept and Oct tops.


I. Sentiment Indicators

The overall Indicator Scoreboard (INT term, outlook two to four months) bearish sentiment continued to decline, now just a fraction above an official SELL.


The INT view of the Short Term Indicator (VXX $ volume and Smart Beta P/C [ETF Puts/Equity Calls], outlook two to four months) bearish sentiment fell sharply last week, reaching the lowest level of the past three years.


The VXX $ Vol also fell sharply, now about the same as the Jan 2020 top and just before the June drop of SPX 200 pts the last half of the month.


Last month, I skipped the CITI Surprise Inflation Index because there was little change, but Dec shows a downturn, typically a sign of a slowing economy that may put some downward pressure on bonds. For gold stocks this may be good or bad, depending the outlook for Fed policy.  The most surprising aspect is that China appears to be in a deflationary spiral, whether their economic "recovery" is bogus or US tariffs and sanctions are taking a hit is unknown.

Bonds (TNX).  Bearish sentiment in bonds continued to be little changed as rates creep up toward 1%.


For the INT outlook with LT still negative, the gold miners (HUI) bearish sentiment is slightly higher as prices rallied back to the lower TL.


II. Dumb Money/Smart Money Indicators

The option-based Dumb Money/Smart Money Indicator as short/INT term (outlook 2 to 4 mns/weeks) bearish sentiment is only modestly lower as a moderate amount of skepticism remains.


And the sister options Hedge Ratio bearish sentiment fell more sharply as hedging has decreased, but not to the danger level.


The INT term SPX Long Term (2x/DM) ETFs (outlook two to four weeks) bearish sentiment shows a sharp drop in ST EMAs, but LT have not yet reached levels seen before prior corrections.


The INT term NDX Long Term (2x/DM) ETFs (outlook two to four weeks) bearish sentiment (no chart. see QQQ OI).


III. Options Open Interest

Using Thur closing OI, remember that further out time frames are more likely to change over time, and that closing prices are more likely to be effected. Delta hedging may occur as reinforcement, negative when put support is broken or positive when call resistance is exceeded.  This week I will look out thru Dec 11. Also, this week includes a look at the GDX for Dec exp.  The Dec EOM remains unchanged with the large OI in SPX calls at 3515&25.

With Fri close at SPX 3699, options OI for Mon are fairly light with call resistance starting at 3675 and most of the put support in the 3400's.  A drop to or below 3675 is expected.


Wed has somewhat smaller OI where SPX put support moves down to 3575, but call resistance moves up near to 3700, so prices can go either way.


For Fri options OI is larger with strong put support up to 3600 and call resistance moves down to 3650.  With low P/C overall, this may be a setup for a pre exp pullback before a high vol distribution top Dec exp (18th).  Prices likely to drop to at least 3650. The last high vol top on an EOQ exp was Sept of 2018.


For the QQQ (NDX/41, 12.3k=300), closing at 305/12528, is mostly neutral between 290 and 300 with minor call resistance at 305 and large at 310.


Using the GDX as a gold miner proxy, closing at 35.3, it is now at neutral support/resistance which was 37+ two weeks ago.  In the last two weeks, about 80k calls have been added between 35-8 with 20k puts added at lower prices.   The drop in P/C increases the likelihood of more downside.


Currently the TLT is 155.2 with the TNX at 0.96% and the TNX is at the top of my expected range of .75 to .95%. 


IV. Technical / Other - LT in conflict with ST

For a LT indicator, I am using the Rydex Bear/Bull Asset ratio. Over the last three years, this ratio has fallen to about .035 before a INT top (Jan, Oct 2018, Feb 2020) comparing the current level to Dec 2019, this may indicate about 200 SPX pts of upside remaining.


For the ST, the Equity P/C factors have been accurate for the Sept and Oct tops. Looking at the vol of puts & calls (adj for SPX volume), the level of calls (dumb money) is at new highs, while the level of puts (smart money) is lower than the previous ST tops. Thus it is likely (at this time) that a correction of about the same magnitude as Sept and Oct is due.


Looking at the equity calls vs equity p/c, the speculative measure is showing a strong SELL.


Looking at the equity puts vs equity p/c, the hedging measure is showing a weaker SELL, comparable to the Sept and Oct tops.


Conclusions.   I have been watching the Rydex Bear/Bull for several weeks to see if it would confirm an INT top, but so far it has not.  From a LT perspective Rydex Bear Bull 1998-2020, it's possible we are in a rounded bottom as in 2000 given the blow off in Techs, but it could also mean a rally of a couple hundred SPX pts higher or possibly the rounded top (H&S) as shown in the DAX earlier this year.

Weekly Trade Alert.   SPX is likely to see a minor pullback next week to 3650 or slightly lower before a final push higher for the year into options exp Dec 18.  Updates @mrktsignals.

Investment DiaryIndicator Primer,
 update 2020.02.07 Data Mining Indicators,
 update 2019.04.27 Stock Buybacks,
 update 2018.03.28 Dumb Money/Smart Money Indicators