Last week started much as expected with the SPX rising toward the 4450 area
by Wed (4443 act)., and following the M/W/F options OI targets. Oddly,
Tu/Th were both negative with Thur particularly violent following the NVDA EPS
outlook which took the after hours SPX (FX) to 4474 which meet the minimum
target of a 50%+ retrace (4471) of the Aug decline (4607-4335). EW
analysts almost unanimously started clamoring for 5 waves down to SPX 4250 to
confirm a larger move down, but Fri late recovery to SPX 4406, from a Powell's
hawkish speech at Jackson Hole and selloff to the SPX 4350s, may have voided that
outlook. Bonds remain a major concern as Mon saw the TNX spike to 4.36% to
take out the Oct 2022 high of 4.33% before reversing to 4.2%. The possible
"handle" of the TNX cup and handle remains questionable with bond sentiment
(TBT/TLT) remaining near the strong Sell.
Bearish sentiment increased slightly overall even as price rose overall with
a strong Buy remaining ST for the Hedge Spread indicator. COT data shows a
strong increase in bearish sentiment for the DJIA (YM) rising from a neutral
level to +.75 SD, just short of a weak Buy. Last week I indicated that for
one scenario to the SPX 4550+ area, I expected an expanding wedge in price and
time, so to clarify, a 2-3 week decline early Aug (a) would lead to a 4-6 week
rally into mid-late Sept (b) then a 8-12 week decline Oct-Dec (c).
The SPX option components for the INT/LT Composite indicator have been
removed this week due to previous problems with the volume of 0DTE options.
I. Sentiment Indicators
The INT/LT Composite indicator (outlook 3 to 6+ months) has three separate
components. Starting Aug 26, 2023 SPX options are removed due to extreme 0DTE volume
distortions. New weights are ETF put-call indicator (30%), SPX 2X ETF INT
ratio (40%), and a volatility indicator (30%) which combines the options
volatility spread of the ST SPX (VIX) to the ST VIX (VVIX) (20%) with the UVXY $ volume (10%).
Update Alt. Bearish sentiment since the beginning of Aug has risen from a
weak Sell to above neutral.
Update Alt EMA. Bearish sentiment looks a lot like Jan-Feb 2021 where a minor
correction unfolded, but prices continued to rise for about a year.
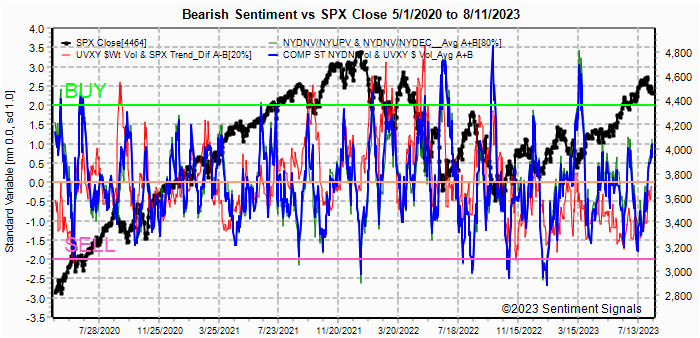
The ST Composite as a ST (1-4 week) indicator includes the NYSE volume ratio
indicator (NYDNV/NYUPV & NYDNV/NYDEC) and the UVXY $ Vol/SPX Trend. Weights
are 80%/20%.
Update. Bearish sentiment rose modestly Thur-Fri with the increased
volatility.
Update EMA. Bearish sentiment rose last week, but remains below the weak Buy.
This may be following the path after May 2021 where prices rose slowly until
sentiment picked up.
The ST/INT Composite indicator (outlook 1 to 3 months) is based on the Hedge Spread (48%)
and includes ST Composite (12%) and three options FOMO indicators using SPX (12%),
ETF (12%), and Equity (12%) calls compared to the NY ADV/DEC issues (inverted). FOMO
is shown when strong call volume is combined with strong NY ADV/DEC. See
Investment Diary
addition for full discussion.
Update EMA. Bearish sentiment remains around the neutral level.
Bonds (TNX). Bearish sentiment remains in the weak Sell area
which continues to surprise. In 2017-18 rates rose from 1.3% to 3.3% and
bearishness was extremely strong before the 2019-2020 rate decline, but now
after a 4% rise from .5%, everyone is bullish.
For the INT outlook with LT still negative, the gold miners (HUI) bearish
sentiment is presented in a new format using the data mining software to add
the inverse TNX rate to the ETF ratio.
Update. Bearish sentiment in ETFs saw a sharp spike last week, but prices
remain subdued due to high int rates and continued weakness in China (SSEC).
II. Dumb Money/Smart Money Indicators
This is a new hybrid option/ETF Dumb Money/Smart Money Indicator as a INT/LT
term (outlook 2-6 mns) bearish sentiment indicator. The use of ETFs
increases the duration (term).
Update. Bearish sentiment bounced off a strong Sell, but may also be
following the Jan-Feb 2021 path of a complex correction.
With the sister options Hedge Spread as a ST/INT indicator
(outlook 1-3 mns), bearish sentiment moved back to a strong Buy ST (grn) and
should help prices move higher and provide support from intraday weakness as
last weeks Thru-Fri declines.
A new composite SPX options indicator uses both the volume adj (1/B-A) and P/C
equivalent spread (A-B) to compensate for the discrepancy between the two.
This replaces the old SPX options indicator for the SPX ETFs + options below and the
INT/LT composite. No chart
For the SPX, I am switching to hybrid 2X ETFs plus SPX options. Taking a look at the
INT term composite (outlook 2 to 4 mns), bearish sentiment remains weak, but
may be bottoming as in May 2021.
For the NDX combining the hybrid ETF options plus NDX 3X ETF sentiment with the interest rate effect,
(outlook 2 to 4 mns) bearish sentiment shows similar extremes between ETF and
options as in late 2020 which resulted in a choppy market until options
sentiment rose. Note QQQ options are optimal, but are N/A and are included
in ETF options.
Bearish sentiment increased slightly with the Thur-Fri volatility, and
remains above neutral.
III. Options Open Interest
Using Thur closing OI, remember that further out time frames are more likely
to change over time, and that closing prices are more likely to be effected.
Delta hedging may occur as reinforcement, negative when put support is broken
or positive when call resistance is exceeded. This week I will look
out thru Sept 1. A text overlay is used for extreme OI to improve readability,
P/C is not changed. A new addition is added for OI $ amounts with breakeven pts (BE) where
call & put $ amounts cross.
With Fri close at SPX 4406, options OI for Mon is moderate with little OI bias
between 4375-4450, but deep ITM puts ($OI) may provide an upward bias toward
4425.
Wed has smaller OI where SPX outlook is about the same as Mon.
For Thur EOM strong OI has a positive bias to SPX 4450+.
For Fri Jobs report moderate OI has very strong put support at SPX 4400 and
below, and moderate support up to 4450, while call resistance starts at 4475 and
is strongest at 4500. A likely target may be around 4475.
IV. Technical / Other
The following uses barcharts.com as a source and discusses S&P futures (ES) as a third
venue of stock sentiment in addition to options and ETFs. The non-commercial/commercial
spread represents a LT bearish sentiment (dumb money/smart money) indicator. As explained in investopedia,
commercial investors (red) are institutions and are smart money, while non-commercials (green) are speculators such as
hedge funds and are dumb money. Here is the current barchart graph
for the S&P 500 (top) and trader positions (1st bot) with positives as net longs and negatives
as net shorts.
Bearish sentiment is represented by the spread and is positive if red > green
(Buy) and negative if green > red (Sell). ES sentiment is neutral at >
+.5 SD and now about the same as Sept 2020, YM (DJIA)
increased sharply to +.75 SD, Dow theory may keep DJIA up thru Sept-Oct, watch for Sell at -1 to -2 SD.
Click dropdown list to select from the following options:
Tech / Other History
2023
2022
Other Indicators
Conclusions. Sentiment is only slightly more bearish than last
week, except for the DJIA futures that may mean a return to relative strength
for the cyclicals vs techs. SPX options OI is indicating a possible
reverse of last week with a neutral Mon/Wed outlook and a Thru/Fri outlook for
gains to the mid 4450-4500 area. Fri with unemployment data shows very
large bearish sentiment and seems most likely to surprise to the upside.
Weekly Trade Alert. Prices may drift around early in the week, but
strength may return late in the week to about SPX 4475 by Fri close. Updates @mrktsignals.
The last few months, I indicated that stocks could continue tp rally with the
TNX below 4% and would face headwinds if rates rose over 4%, but last week and a
half the sustained breakout over 4% was more like a tornado. Rates rose
six days in a row thru Thur, reaching a new closing high of 4.3% compared to
4.25% Oct 2022 with the main culprit being Wed July's retail sales which caused
some to estimate Q3 GDP at 5%+ and the FOMC notes which were hawkish. The
SPX swooned Wed thru Fri AM dropping from 4450 to a Fri open at 4335.
The strength of the decline seemed to eliminate the traditional scenario
outline last week, so I am going to concentrate this week on the two more
bearish outcomes where much depends on the course of int rates (TNX). I
had been looking for a rounded bottom, or "cup and handle"
for the TNX where the "cup" sides are complete, but the "handle" implies a
retracement to about 3.8% before a breakout. If the handle forms there
could still be a retracement to the SPX 4550+ area in Sept which is also
consistent with the Thur EW outlook by Dr. Schure
(no J/S, reload). So Scenario 1 (50%) assumes that rates retrace and the SPX gap fills
at 4565. From there, the c-wave sees a-down of 272 pts (4607-4335) x 1.62
extension to 4125 for a 10% decline (see scenario 2 for rate dependency).
This would likely be an expanding wedge in price and time to EOY. Scenario
2 (50%) assumes that rates continue to rise where the lows will be about SPX 4125 if
rates remain below 5%, but over 5% a 15% decline to about SPX 3920 is likely by
EOY, this is also the 62% retrace of the entire rally from the Oct lows of 3490.
Sentiment is somewhat mixed with major distortion from new record volume in
SPX puts and calls (see DM section). The ST composite did reach a weak Buy
while the VIX call indicator is near a strong Buy. Other positive INT
indicators are the Hedge Spread that reached a ST strong Buy and the NDX indicator
that reached levels comparable to lows in 2020 and 2021. Bond sentiment
remains weak, but over the weak Sell. SPX options OI last week showed a BE
at/near 4300 which was surprisingly accurate and this week are a 4600 with large
EOM OI showing a BE of 4550. All together this seems to support a retracement
of 50%+.
I. Sentiment Indicators
The INT/LT Composite indicator (outlook 3 to 6+ months) has three separate
components. 1st is the SPX and ETF put-call indicators (40%), 2nd the SPX 2X ETF INT
ratio (30%), and 3rd a volatility indicator (30%) which combines the options
volatility spread of the ST SPX (VIX) to the ST VIX (VVIX) with the UVXY $ volume.
This week breaks SPX options into volume adj (1/B-A) and traditional spread (A-B).
Update Alt. In this case the wts for the SPX 2X ETF ratio (SDS/SSO) and SPX puts &
calls spread are adj to equal as in the DM/SM section for SPX ETFs. Bearish sentiment
shows a large drop mainly due to SPX options. The DM section shows a
drilldown of SPX puts & calls and record volume (0DTE) is likely distorting
sentiment.
Update Alt EMA. Bearish sentiment fell sharply.
The ST Composite as a ST (1-4 week) indicator includes the NYSE volume ratio
indicator (NYDNV/NYUPV & NYDNV/NYDEC) and the UVXY $ Vol/SPX Trend. Weights
are 80%/20%.
Update. Bearish sentiment reached the weak Buy level and means a ST rally is
likely soon.
Update EMA. Bearish sentiment is showing that ST EMAs are still similar to
May, so a strong advance is unlikely.
Also, looking at the ST VIX Call & SPXADP indicator, bearish sentiment is
near a strong Buy so lower VIX and higher SPX are likely for the next 2-4 weeks.
The ST/INT Composite indicator (outlook 1 to 3 months) is based on the Hedge Spread (48%)
and includes ST Composite (12%) and three options FOMO indicators using SPX (12%),
ETF (12%), and Equity (12%) calls compared to the NY ADV/DEC issues (inverted). FOMO
is shown when strong call volume is combined with strong NY ADV/DEC. See
Investment Diary
addition for full discussion.
Update EMA. Bearish sentiment has turned positive but remains below a weak
Buy, so a partial retrace for several weeks should start soon.
Bonds (TNX). Bearish sentiment shows a moderate uptick, so a
partial retrace is possible but not likely to last.
For the INT outlook with LT still negative, the gold miners (HUI) bearish
sentiment is presented in a new format using the data mining software to add
the inverse TNX rate to the ETF ratio.
Update. Bearish sentiment rose moderately. As discussed above if int
rates retrace, HUI may rally 10% back toward 235-40.
II. Dumb Money/Smart Money Indicators
This is a new hybrid option/ETF Dumb Money/Smart Money Indicator as a INT/LT
term (outlook 2-6 mns) bearish sentiment indicator. The use of ETFs
increases the duration (term).
Update. Bearish sentiment remains little changed.
With the sister options Hedge Spread as a ST/INT indicator
(outlook 1-3 mns), bearish sentiment saw a sharp move back to the strong Buy
level although LT EMAs are lagging. A strong retracement over the next
4-6 weeks is possible, but new highs are unlikely.
A new composite SPX options indicator uses both the volume adj (1/B-A) and P/C
equivalent spread (A-B) to compensate for the discrepancy between the two.
This replaces the old SPX options indicator for the SPX ETFs + options below and the
INT/LT composite. Here, I am showing the raw SMA puts& calls with ratio. The
extreme high volume (0DTE effect?) is usually bearish, while low P/C is bullish.
Large spikes in put buying is usually a ST bottom.
For the SPX, I am switching to hybrid 2X ETFs plus SPX options. Taking a look at the
INT term composite (outlook 2 to 4 mns), bearish sentiment fell sharply
mainly due to the extreme SPX optn volume.
For the NDX combining the hybrid ETF options plus NDX 3X ETF sentiment with the interest rate effect,
(outlook 2 to 4 mns) bearish sentiment shows similar extremes between ETF and
options as in late 2020 which resulted in a choppy market until options
sentiment rose. Note QQQ options are optimal, but are N/A and are included
in ETF options.
Bearish sentiment rose sharply over neutral, pulled upward by ETF options and
is at a level similar to Mar 2021 and could see a strong retrace of the current
decline.
III. Options Open Interest
Using Thur closing OI, remember that further out time frames are more likely
to change over time, and that closing prices are more likely to be effected.
Delta hedging may occur as reinforcement, negative when put support is broken
or positive when call resistance is exceeded. This week I will look
out thru Aug 25 & EOM. A text overlay is used for extreme OI to improve readability,
P/C is not changed. Also, this week includes a look at the GDX & TLTfor Sept exp.
A new addition is added for OI $ amounts with breakeven pts (BE) where
call & put $ amounts cross.
With Fri close at SPX 4370, options OI for Mon is moderate with strong put
support at 4375.but a gap below until 4300. Negative news could push
lower, but above 4375, 4400 is likely.
Wed has moderate OI where SPX with large put OI at 4460 and 4475 similar to
last week, but are now deep ITM. Aug flash PMIs are out early,
but likely to pull prices up over 4400 toward 4450.
For Fri stronger OI are likely to pull prices up toward the 4400-4450 level. .
For Thur EOM SPX has very large OI and a BE at 4550 and a move to 4450-4500 by
EOM looks likely.
Using the GDX as a gold miner proxy closing at 27.5, prices should push higher
toward 30-31.
Currently the TLT is 93.8 with the TNX at 4.25%, and should recover back toward
the 100+ level.
IV. Technical / Other
The following uses barcharts.com as a source and discusses S&P futures (ES) as a third
venue of stock sentiment in addition to options and ETFs. The non-commercial/commercial
spread represents a LT bearish sentiment (dumb money/smart money) indicator. As explained in investopedia,
commercial investors (red) are institutions and are smart money, while non-commercials (green) are speculators such as
hedge funds and are dumb money. Here is the current barchart graph
for the S&P 500 (top) and trader positions (1st bot) with positives as net longs and negatives
as net shorts.
Bearish sentiment is represented by the spread and is positive if red > green
(Buy) and negative if green > red (Sell). ES sentiment continues to
fall, now at +.5 SD, YM (DJIA)
is at neutral at 0 SD, Dow theory may keep DJIA up thru Sept-Oct, watch for Sell at -1 to -2 SD.
Click dropdown list to select from the following options:
Tech / Other History
2023
2022
Other Indicators
Conclusions. Last weeks economic news all but killed any hopes an
econimic slowdown any time soon and lower rates from the Fed. On the plus
side stronger growth usuually means stronger earnings hence the ebb and flow
pushing stocks lower as rates rise then higher when rates stabilize.
Hopefully, the lows will be seen in earnings in Oct-Nov as well as a good
portion of the high rates surprise, setting the stock market up for a positive
2024. As outlined above, the course of the stock market thru EOY will
likely include a 10-15% decline depending on int rates (TNX). Sentiment is
not that favorable for bonds which increases uncertainty. Aug 24-25 is
Jackson Hole where global CB leaders discuss outlook. Everyone has been
expecting China to come out with a big stimulus package, but this would likely
weaken the yuan. China may be concerned that if they support a gold-backed
currency, a weaker yuan means cheaper exchange prices for gold. No
stimulus from China may help lower int rates.
Weekly Trade Alert. A modest turnaround is expected next week for
the SPX to 4400-50 and possibly 4450-500 thru EOM. Updates @mrktsignals.
Last week was overall somewhat weaker than expected, but mostly within the
target range of SPX 4450-4550. The early bounce to SPX 4500+ (4518) only
lasted a day as weak data from China Tue set a negative tone to the market and
took prices back to the 4470s. Weakness lasted thru Wed with the expected
CPI rally lasting only about an hour, but did hit the target zone of SPX
4520-40 (4527). A disastrous 30 yr T-Bond auction Thur sent the LT bond
int rates back to test the prior weeks highs and reversed the SPX 55 pt gain to
a 15 pt loss by EOD. Higher PPI data Fri pressured TNX rates on Fri,
causing an SPX 15 pt loss for the week. On a positive note the SPX did bounce
off its 50 SMA and filled a gap at 4445-50. The question is will the gap at
SPX 4550-65 be filled before a larger down leg? The bad news is that bond
sentiment (TBT/TLT) is little changed and I am getting the same feeling I had in
mid-2021 right before TNX rates rose from 1% to 3%.
Today I want to look at three possible outcomes for the next 3-6 mns.
The first (prob 40%) is the contrarian view based on what I see sentiment wise.
I do think the will be a fill of the gap at SPX 4550-65, but sentiment is
currently too weak and a consolidation is likely to last thru Aug (range
4440-4500) similar to Apr-May. Then Sept with triple witch, FOMC and EOQ
the gap is filled. The high risk period is mid-Oct to mid-Dec when
inflation pressure and rising rates accelerate and EPS continues to disappoint,
pushing the SPX toward the 4100 area (top of A).
Second is the crash scenario (30%) for me the reason is rates continue to rise
due to higher inflation and new Treasury sales, pressuring Techs with the TNX
rising to 5-5.5% by EOY and the NDX filling a large gap around 13.5K and the SPX
down about 15%. Avi has a similar view, probably supported by an expected
banking crisis. In Avi's case
the SPX rises to 4550-65 for Aug optn exp, then down to 3800 by mid-Dec.
The third case which I call the traditional view (30%) is a decline into
Sept-Oct to about SPX 4300 then a rally into EOY to 4700-4800. Here we have
EW's Dr Schure (no J/S,reload)
and TA's ExecSpec.
Bond market sentiment is my biggest concern. An interesting article in
ZH
discussed some interesting divergences between futures (TN) and options (TLT)
which agreed with the extreme retail bullishness shown in the TBT/TLT sentiment
indicator. Otherwise sentiment is improving for the SPX/NDX but does not
indicate a strong turnaround for optn exp week. Due to the possible
influence of the Dow Theory a look at DJIA futures (YM) is included in the
Tech/Other section. The easiest way to view in COT is to edit url
replacing ES with YM and return. An additional link is added to Other
links for Marketwatch news releases (note Wed).
I. Sentiment Indicators
The INT/LT Composite indicator (outlook 3 to 6+ months) has three separate
components. 1st is the SPX and ETF put-call indicators (40%), 2nd the SPX 2X ETF INT
ratio (30%), and 3rd a volatility indicator (30%) which combines the options
volatility spread of the ST SPX (VIX) to the ST VIX (VVIX) with the UVXY $ volume.
This week breaks SPX options into volume adj (1/B-A) and traditional spread
(A-B).
Update Alt. In this case the wts for the SPX 2X ETF ratio (SDS/SSO) and SPX puts &
calls spread are adj to equal as in the DM/SM section for SPX ETFs. Bearish sentiment
declined slightly mainly due to SPX options.
Update Alt EMA. Bearish sentiment remains near the Sell level.
The ST Composite as a ST (1-4 week) indicator includes the NYSE volume ratio
indicator (NYDNV/NYUPV & NYDNV/NYDEC) and the UVXY $ Vol/SPX Trend. Weights
are 80%/20%.
Update. Bearish sentiment has barely touched the weak Buy level.
Update EMA. Bearish sentiment ST EMAs are just above neutral and suggest
more consolidation similar to Apr-May.
The ST/INT Composite indicator (outlook 1 to 3 months) is based on the Hedge Spread (48%)
and includes ST Composite (12%) and three options FOMO indicators using SPX (12%),
ETF (12%), and Equity (12%) calls compared to the NY ADV/DEC issues (inverted). FOMO
is shown when strong call volume is combined with strong NY ADV/DEC. See
Investment Diary
addition for full discussion.
Update EMA. Bearish sentiment continues to rise now above the weak Sell but
still below neutral, the level that supported most rallies in late 2020-21.
Bonds (TNX). Bearish sentiment remains near the Sell level and
is the most worrisome for stocks, esp NDX. Rates may continue to rise
for the next 3-6 mns.
For the INT outlook with LT still negative, the gold miners (HUI) bearish
sentiment is presented in a new format using the data mining software to add
the inverse TNX rate to the ETF ratio.
Update. Bearish sentiment fell sharply and seems to continue to follow the
mid-2018 analog. Probably the uptick in inflation excites the PM bulls,
but the negative interest rate effect should not be ignored. If inflation
and TNX rates continue to rise thru EOY, Fed will likely begin increasing ST
rates killing PMs.
II. Dumb Money/Smart Money Indicators
This is a new hybrid option/ETF Dumb Money/Smart Money Indicator as a INT/LT
term (outlook 2-6 mns) bearish sentiment indicator. The use of ETFs
increases the duration (term).
Update. Bearish sentiment is little changed.
With the sister options Hedge Spread as a ST/INT indicator
(outlook 1-3 mns), bearish sentiment rose sharply above the neutral level and
may increase enough to support a 2-3% rally in a week or two.
A new composite SPX options indicator uses both the volume adj (1/B-A) and P/C
equivalent spread (A-B) to compensate for the discrepancy between the two.
This replaces the old SPX options indicator for the SPX ETFs + options below and the
INT/LT composite. No chart.
For the SPX, I am switching to hybrid 2X ETFs plus SPX options. Taking a look at the
INT term composite (outlook 2 to 4 mns), bearish sentiment fell slightly due
to options extremes (0DTE effect?), while EFT sentiment is neutral.
For the NDX combining the hybrid ETF options plus NDX 3X ETF sentiment with the interest rate effect,
(outlook 2 to 4 mns) bearish sentiment shows similar extremes between ETF and
options as in late 2020 which resulted in a choppy market until options
sentiment rose. Note QQQ options are optimal, but are N/A and are included
in ETF options.
Bearish sentiment rose to the weak Sell level on the back of ETF option
sentiment while NDX ETF sentiment is little changed.
III. Options Open Interest
Using Thur closing OI, remember that further out time frames are more likely
to change over time, and that closing prices are more likely to be effected.
Delta hedging may occur as reinforcement, negative when put support is broken
or positive when call resistance is exceeded. This week I will look
out thru Aug 18. A text overlay is used for extreme OI to improve readability,
P/C is not changed. Also, this week includes a look at the GDX for Dec exp.
A new addition is added for OI $ amounts with breakeven pts (BE) where
call & put $ amounts cross.
With Fri close at SPX 4464, options OI for Mon is moderate and shows some
support for a rally to 4500, but there is little support until 4425.
Wed has somewhat smaller OI where SPX has very strong support at 4455 and 4470.
News (see Tech/Other Links) includes housing ind prod, and FOMC notes.
For Fri AM strong SPX OI levels with deep ITM calls skewing $ amounts, most
likely target 4450-4500..
For Fri PM moderate SPX OI levels with deep ITM calls skewing $ amounts, most
likely target 4450-4525..
IV. Technical / Other
The following uses barcharts.com as a source and discusses S&P futures (ES) as a third
venue of stock sentiment in addition to options and ETFs. The non-commercial/commercial
spread represents a LT bearish sentiment (dumb money/smart money) indicator. As explained in investopedia,
commercial investors (red) are institutions and are smart money, while non-commercials (green) are speculators such as
hedge funds and are dumb money. Here is the current barchart graph
for the S&P 500 (top) and trader positions (1st bot) with positives as net longs and negatives
as net shorts.
Bearish sentiment is represented by the spread and is positive if red > green
(Buy) and negative if green > red (Sell). ES sentiment is neutral,
but lower for the week at
< +1 SD, YM (DJIA)
is neutral at -0.1 SD, Dow theory may keep DJIA up thru Sept-Oct, watch for Sell at -1 to -2 SD.
Click dropdown list to select from the following options:
Tech / Other History
2023
2022
Other Indicators
Conclusions. Bearish sentiment for stocks is rising, but does
not indicate a strong rally next week. .Stocks, esp techs, will continued to be
pressured if rates continue to rise. Athough the SPX found support at its
50 SMA, NDX did not, and may indicate a problem. The DJIA continues to be
the stalwart and seems to bounce strongly every time 35k is tested. If the
DJIA remains strong,losses should be limited, but below the 34.7k level
problems may occur.
Weekly Trade Alert. Not expecting much action next week with the
SPX remaining in the 4440-4500 range unless bonds break down with TNX above
4.25-4.33%. Fri may see a late bounce over SPX 4500 if rates remain calm. Updates @mrktsignals.