Saturday, December 29, 2018

Mad Men

Are the Mad Men (AMC) running the White House?  Petulant, womanizing, domineering and questionable morals, does this sound familiar?  Views by Noriel Roubini and PhilStockWorld.  The stock market certainly seems to think so measured by the last three months performance, while bonds and gold stocks seem to be in short supply as prices are bid up in safe haven demand.

Last week's outlook was for a rally into the EOY with possible ST tax loss selling driving the NDX and SPX lower first to 5800 and 2350, respectively.  The NDX missed by 100 pts, while the Christmas Eve massacre drove the SPX to a close of 2351, and Tue gap up retest saw 2347 before a 120 pt romp upward into the close.

Last Dec, here and here, I was looking for a strong start in Jan 2018 to send a "false signal" via the January effect with weakness to follow similar to 1970-71.  Jan 2019, I expect a similar, but opposite, "false signal" with a weak beginning but stronger prices for most of the year.  In the forecast for 2019, I look at the biggest hurdles for higher prices for 2019 including China trade, Fed rate hikes and the Mueller report.  Also discussed are three analogs including the 1970s, the 1998 LTCM crisis and the 2010 midterm period using sentiment measures $SKEW and $NYUPV/$NYDNV.  So far the 1998 crisis, followed by a strong bull market to the 2000 top, seems the closest to the current market period with a closer look in the Technical Indicator section.

I. Sentiment Indicators

The overall Indicator Scoreboard (INT term, outlook two to four months) bearish sentiment has topped out slightly higher than the Mar-Apr retest and is consistent with an SPX 400+ pt rally.


The INT view of the Short Term Indicator (VXX+VXXB $ volume and Smart Beta P/C, outlook two to four months) bearish sentiment has reached the levels of the Feb lows, in a reverse pattern to the Feb-Apr period, but also consistent with an SPX 400+ pt rally.


Bond sentiment (TNX) continued to decline thru the week, matching the lowest levels of the year.  Combined with the SPX/TNX ETF sentiment (2nd chart), the indication is that once money starts flowing back into stocks as happened last Apr, the rise in int rates will be stronger than Apr-Oct.


For the INT outlook with LT still negative, the gold miners (HUI) bearish sentiment is also nearing the levels seen in July before the meltdown from HUI 170 to 140.  Suggesting that resolution of the China trade crisis could see sharp reversals for both bonds and gold stocks


II. Dumb Money/Smart Money Indicators

The Risk Aversion/Risk Preference Indicator (SPX 2x ETF sentiment/NDX ETF sentiment, outlook 2 to 4 wks/mns) as a INT indicator has dropped back to neutral showing that SPX and NDX should have similar performance.


The option-based Dumb Money/Smart Money Indicator as INT term (outlook 2 to 4 weeks/mns) moved from a strong SELL early Dec to a BUY, slightly stronger that the Mar-Apr retest and then moved back to neutral about where the Apr rally began.


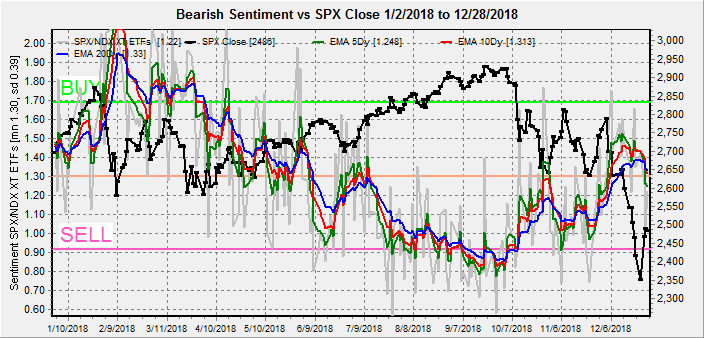
The INT term SPX Long Term/Short Term ETFs (outlook two to four weeks/mns) bearish sentiment remains the most conservatively positioned indicator as the rise has been due to dumb money selling, but still no smart money buying.  Rallies are likely to remain tepid until smart money buying picks up.


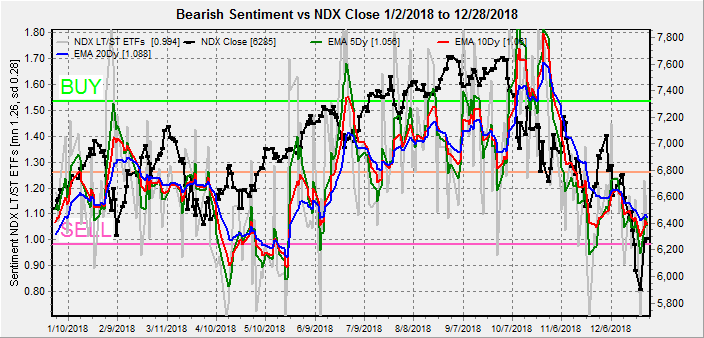
Long term neutral, the INT term NDX Long Term/Short Term ETF Indicator (outlook two to four weeks/mns) as the long cycle seems to follow prices, the short cycle has moved back to the long cycle trend.


III. Options Open Interest

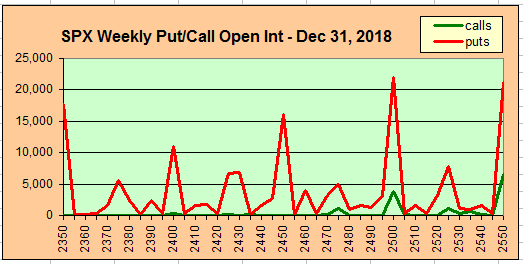
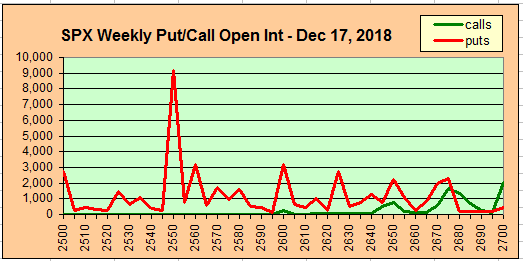
Using Thurs close, remember that further out time frames are more likely to change over time.  M/F dominance by puts indicates inflection pts.  This week I will look out thru Jan 4.

Mon with Fri close at SPX 2486. Below SPX 2500 there is a fluid range between 2450 and 2500 and strong support at 2400.  Large open int, probably range bound.


Wed shows the strongest call resistance seen in a while at SPX 2525 as everyone seems to expect an up day. Fluid range between 2415 and 2490.  Light open int overall.


Fri, jobs report, has large open int with SPX 2500 a major inflection pt.  With all puts, its hard to draw any better conclusions.  Over 2500 could show attraction to 2580.


IV. Technical / Other

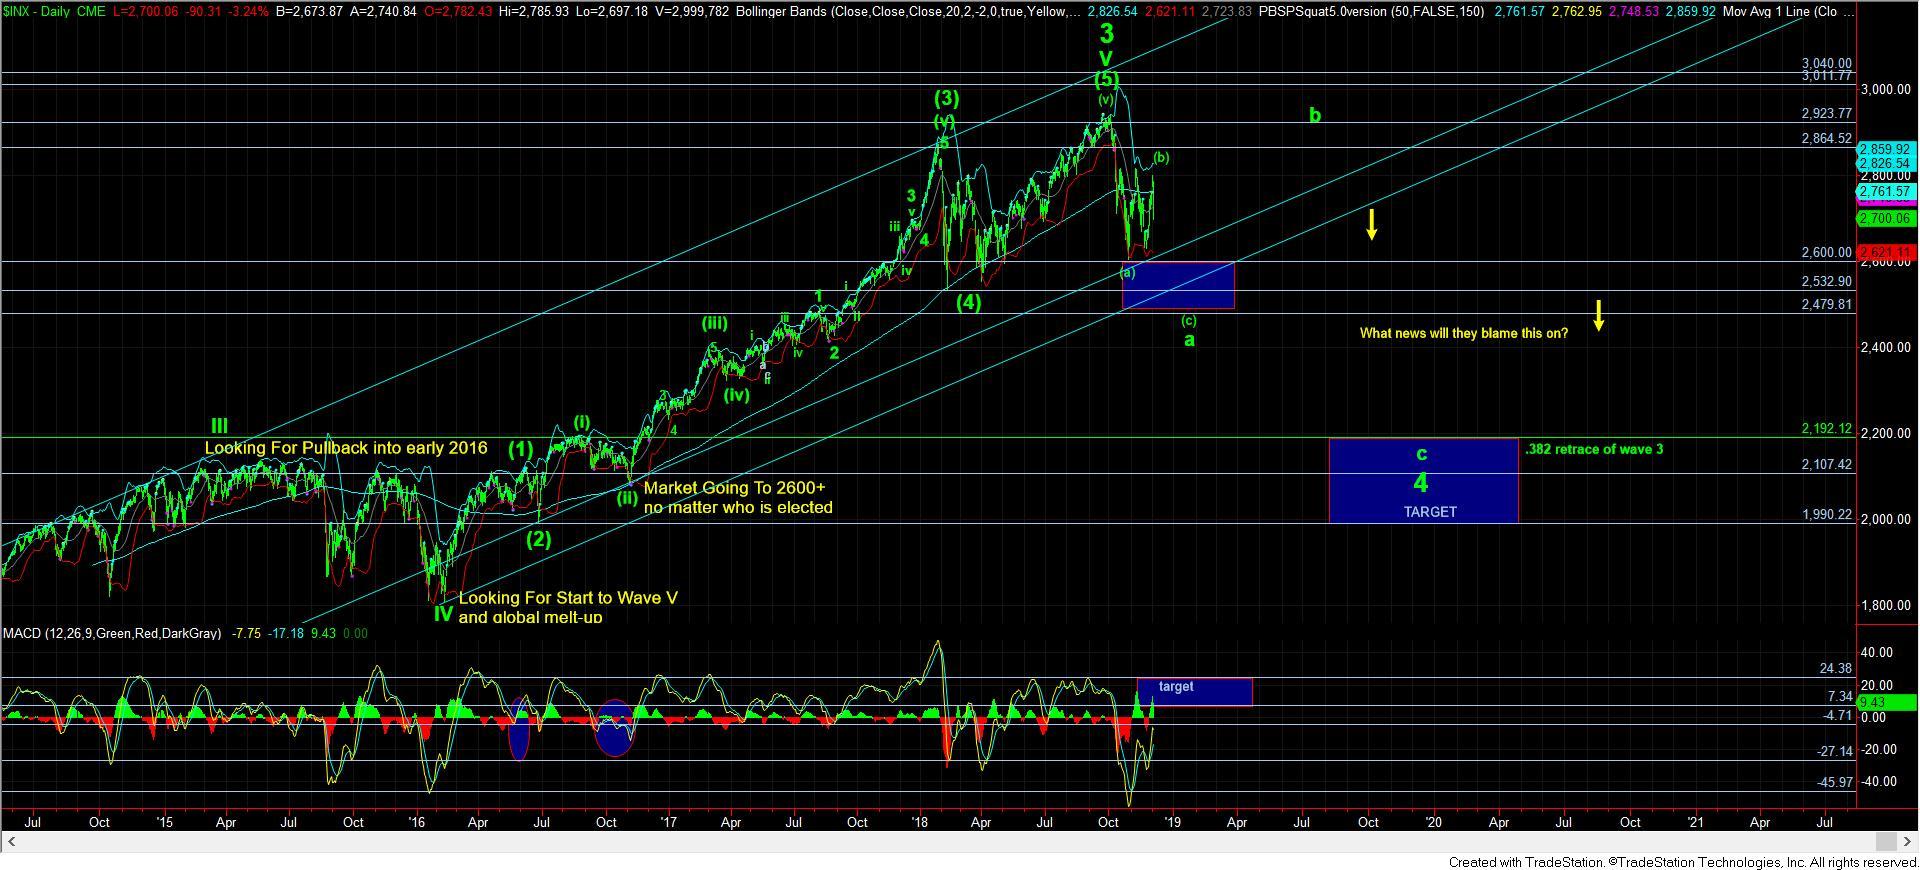
Looking at the analog for the 1998 LTCM crisis that lasted six weeks compared to the current Oct-Dec decline that lasted twelve weeks it seems logical to apply a 2x timeline.  After the lows on Sept 1, the SPX rallied for four weeks in a well define bear flag with about 6% rallies followed by 4% pullbacks in seven waves up.  Today that would be about 4 up legs of 150+ pts with 100+ pt pullbacks, pointing to about SPX 2650-70 late Feb.  Obviously analogs never work perfectly, but a pullback next week to 2400+ on govt shutdown fears followed by a strong rally over a compromise by next weekend would fit.


Conclusions.  INT sentiment shows that the SPX is at/near a major bottom similar to Mar/Apr, but the SPX ETF Indicator is only at neutral so no strong rally is expected soon.  The 1998 analog indicates a possible two month sawtooth rally to retrace 50% of the decline from SPX 2941 to about 2650 by late Feb.  Mar is likely to see a return to volatility and a retest of the lows with the FOMC and China trade talks in focus.  The Mueler report is expected out in Feb and may mark a ST top.

Weekly Trade Alert.  The 1998 analog indicates a drop next week to the SPX 2400-20 area with a following rally of about 150 pts that could start Fri if a govt shutdown solution or other news is expected next weekend.  Updates @mrktsignals.

Investment DiaryIndicator Primer,  update 2018.03.28  Dumb Money/Smart Money Indicators
Article Index 2018 by Topic
Article Index 2017 by Topic
Article Index 2016 by Topic
Long term forecasts

© 2018 SentimentSignals.blogspot.com

Saturday, December 22, 2018

A Week to Remember

Reverse seasonality.  As I warned in mid-Nov as many analysts and investors we looking for a permanently high plateau in stock prices with EOY SPX projections of 2850-2900 and an end to the China trade war, the same complacency was seen prior to Oct 1929.  Last week, however, saw true panic with Fri SPX volume swelling to twice the months daily average and dumb money, which only gets out at bottoms, exited at levels seen at the Mar-Apr lows.  The proximate cause seemed to be a "surprise" hawkish stance by the Fed, but I have been saying since the trade wars began that the US and global economies would slow in 2019 leading to the Feds rate hikes to be put on pause mid-2019.  In the technical indicator section, I have added a chart showing the economic indicator with the strongest correlation to fed funds rates and it is not inflation.

Most of the sentiment indicators have reached levels seen at Apr retest lows, but a consolidation at lower price levels for 1-2 weeks is likely, possibly SPX 2400-2500.  One scenario is an EOY rally followed by an early Jan retest of the lows.  I've found only one analyst looking for higher prices in 2019, a true contrarian sign for higher prices.

I. Sentiment Indicators

The overall Indicator Scoreboard (INT term, outlook two to four months) bearish sentiment has risen to levels equal the Oct lows and midway thru the Mar-Apr retest.  For a lasting bottom a rounded top in sentiment aka Apr is preferred.


The INT view of the Short Term Indicator (VXX $ volume and Smart Beta P/C, outlook two to four months) bearish sentiment has reached the highest levels since the Feb lows and may support a quicker turnaround than expected.  Note the VXX ETN retires on Jan 29, 2019 and is to be replaced by a 30 yr VXXB, so there may be a ST reliability issue at that time.


Bond sentiment (TNX) continues to follow the June/July pattern that points to higher rates once the stock market turns around.


For the INT outlook with LT still negative, the gold miners (HUI) bearish sentiment remains unchanged while prices continue to fluctuate vs ST moves in the US dollar.


II. Dumb Money/Smart Money Indicators

The Risk Aversion/Risk Preference Indicator (SPX 2x ETF sentiment/NDX ETF sentiment, outlook 2 to 4 days/wks) as a INT indicator remains above neutral indicating modest preference for SPX to NDX.


The option-based Dumb Money/Smart Money Indicator as short/INT term (outlook 2 to 4 days/weeks) saw a sharp move up on Fri matching the first mid Mar low, so a couple weeks of volatility is probably needed for a strong rally.


The INT term SPX Long Term/Short Term ETFs (outlook two to four weeks) bearish sentiment actually turned down last week, but as the accompanying SDS/SSO ETF chart shows, dumb money (2x) selling has reached the extremes of the Oct lows and is midway between the Feb and Apr lows.  The cause is high smart money selling, so volatility is likely to continue for a while.


Long term NDX Long Term/Short Term ETF Indicator (outlook two to four weeks) as the long cycle seems to follow prices, the short cycle is slightly lower.  The LT chart shows price support around the 5800 level and is the only remaining negative sentiment indicator.  Hard to tell if there will be a final flush lower of tax loss selling next week.


III. Options Open Interest

Using Thurs close, remember that further out time frames are more likely to change over time.  This week I will look out thru Dec 31.

Mon/Wed are mostly puts from SPX 2350-2550 and show little directional bias.  Light open int overall.  No charts.

Fri has moderate open int showing below SPX 2400 next pivot is 2350, and above 2450.


Mon, Dec 31, is showing pretty much the same with larger open int, from SPX 2400, 2350 or 2450 is equally likely.


IV. Technical / Other

The overwhelming surprise that the Fed "stayed the course" was unexpected as it was what I was expecting all along.  One indicator that has done an excellent job as a coincident (inverse) indicator of Fed rate changes over the past two int rate cycles is the unemployment rate (UR).  As you can see below, the Fed tends to raise rates when the UR falls and lower rates when the UR rises.  In the last two recessions the Fed had to lower rates by over 5% to create job growth, and this is why they are worried about stopping at 2.5%.  The last time, rates were kept at 0% for 6 yrs until late 2015 when the UR fell to 5%.  With current UR at 3.7% (same as 2000), Fed funds policy change is not likely until UR rises over 4%.  UR data from Bureau Labor Statistics, Fed funds from St Louis Fed.  Even though rates began to fall in late 2007, it still did not prevent the bear market in stocks continuing into 2009.  Negative rates are possible, but have not been effective in the EU with UR stuck at 10%.


The TI Composite NYMO+TRIN+NYAD+NYYD has now fully reversed course from a strong SELL early Oct to a strong BUY, in between the Feb low and Mar-Apr lows, so a powerful reversal should be seen soon.


Have we seen capitulation yet?  One of the volume indicators I created a year ago is the $NYDNV/$NYDEC as a Capitulation Indicator.  We are now in between the levels of June 2017 which saw a SPX 450 pt rally after a slightly lower low two wks later and June 2018 which saw a SPX 350 pt rally after a low a few days later.


Historical context.  The current decline continues to closely match the midterm-2010 scenario outlined in late Oct.  Although currently deeper than originally expected, the 2010 decline was 17.1% over 3 months that would equate to SPX 2437 from 2941.  The rally that followed into 2011 lasted 10 months that would be to Oct 2019.  The following decline lasted 5 months and dropped 21.6% and from SPX 2830 (430 pt rally) that would be about 2200.

Conclusions.  As expected last week options open int was little help last week other than the Mon flush to 2530.  The sentiment picture is pretty clear with overwhelming evidence that a strong rally similar to the SPX 400+ pt rally from the Mar-Apr lows is near.  From the current lows my target would be SPX 2800-50, creating a somewhat downward slanting H&S top from Jan and Oct.  The NDX still looks to have more work needed on the downside and it is hard to tell if there will be quick lows from tax loss selling or on a later retest.  In any event, there is no hurry to try to pick a bottom and the next two weeks are likely to be volatile.

Weekly Trade Alert.  An early week decline in the NDX to 5800 (-3%) is likely to send the SPX to 2350 before a stronger bottom, and this should provide a buying oppty targeting SPX 2500+.  However, a short covering rally can also start targeting the 2500 level by EOY or both.  A more secure buying oppty is likely after the first of the year.  Updates @mrktsignals.

Investment DiaryIndicator Primer,  update 2018.03.28  Dumb Money/Smart Money Indicators
Article Index 2018 by Topic
Article Index 2017 by Topic
Article Index 2016 by Topic
Long term forecasts

© 2018 SentimentSignals.blogspot.com

Saturday, December 15, 2018

Sentiment Improving, But

Last week went pretty much as expected as the ST Indicator showed that a pause in the decline was likely and other than some Mon AM volatility, prices closed Mon/Tue at SPX 2638/37 compared to last weeks 2633.  But later in the week selling returned and could even reach a low next Mon at the SPX 2550 target, but sentiment is not pointing to an immediate turnaround.  As shown later, sentiment is actually following the late Mar-Apr retest of the Feb lows.  Looking at the chart below, prices retraced back to the SPX 2800 level before falling to 2585 the same as last Mon and continued in a trading range between 2675 and 2575 over a total of 14 trading days.  The spike low was 2550.  A similar timing pattern would continue thru most of Dec.  Fri sentiment matches that of Mar 22 at SPX 2640.  With many now looking for a move down to the SPX 2400's, this scenario is probably the most contrarian.


I. Sentiment Indicators

The overall Indicator Scoreboard (INT term, outlook two to four months) bearish sentiment continues to rise nearing the levels of Mar 22.


The INT view of the Short Term Indicator (VXX $ volume and Smart Beta P/C, outlook two to four months) bearish sentiment is somewhat lagging the Mar retest.


But the Smart Beta P/C seems to be following the same pattern, but at slightly lower levels that may indicate a weaker rally (no ATH) if we have a Mar-Apr type bottom.


Bond sentiment (TNX) continues to waffle around the neutral zone indicating a likely trading range..


For the INT outlook with LT still negative, the gold miners (HUI) bearish sentiment remains low as the gold bugs keep preaching a collapse of the dollar.


II. Dumb Money/Smart Money Indicators

The Risk Aversion/Risk Preference Indicator (SPX 2x ETF sentiment/NDX ETF sentiment, outlook 2 to 4 days/wks) as a INT indicator has risen over neutral, but is unlikely to reach the early 2018 levels that resulted in a larger rally in NDX (20%) vs the SPX (16%).


The option-based Dumb Money/Smart Money Indicator as short/INT term (outlook 2 to 4 days/weeks) remains at very low levels that may be distorted by put buying in FANGMAN stocks that declined 2x the SPX decline.


The INT term SPX Long Term/Short Term ETFs (outlook two to four weeks) bearish sentiment has been climbing steadily in the last decline as the dumb money (2x ETFs) are heavy sellers compared to smart money (3x ETFs).


This chart shows the INT term SPX Long Term/Short Term ETFs as of Mar 22 for comparison and you can see the levels are similar but slightly lower.


Long term neutral, the INT term NDX Long Term/Short Term ETF Indicator (outlook two to four weeks) as the long cycle seems to follow prices, the short cycle has turned down that may mean ST weakness..


III. Options Open Interest

Using Thurs close, remember that further out time frames are more likely to change over time.  Last weeks dominance by puts showed early and late volatility, but strong support did hold by the close.  This week I will look out thru Sept 21.

With Fri close at SPX 2600, Mon is dominated by puts with little directionality, but strong support at 2550 and little support until 2560.  Light open int overall.


Wed is similar with inflection pts at SPX 2550, 2600 and 2625.  No resistance until 2675.


Fri, optn exp, AM shows large open int mainly puts with inflection pts net at SPX 2550, 2600 and 2650.


For the PM, again mainly puts with inflection pts at SPX 2560 and 2640.


IV. Technical / Other

I am still not sure of the reliability of the NYMO+TRIN+NYAD+NYUD Composite as it was very early with a SELL late Aug, but other times has done much better.  This indicator is also similar to the Mar 22 period.


Conclusions.  So far bearish sentiment is not high enough to support a sustainable rally.  Many are now expecting a crash down to the SPX 2400s, but with strong selling by dumb money (SPX 2x ETFs) a bottom is probably near.  The replay of mid Mar-mid Apr for Dec seems a likely outcome as lows may be limited to SPX 2530-50 while whipsaws in a lower range could build up bearish sentiment.

Weekly Trade Alert.  Options open int does show the possibility of a washout to SPX 2550 on Mon followed by a strong rally, but considering sentiment and similarities to Mar retest, my feeling is that bulls and bears may be whipsawed.  One possibility similar to Mar is a down open on Mon to SPX 2575-85 followed by a strong rally thru FOMC Wed to 2675-85, then disappointment similar to the Dec trade talks that fades to new lows to 2530-60 by Fri/Mon AM then begin a choppy rally into mid Jan to SPX 2700-50.  Updates @mrktsignals.

Investment DiaryIndicator Primer,  update 2018.03.28  Dumb Money/Smart Money Indicators
Article Index 2018 by Topic
Article Index 2017 by Topic
Article Index 2016 by Topic
Long term forecasts

© 2018 SentimentSignals.blogspot.com

Saturday, December 8, 2018

No Bottom in Sight

For some reason the Dec 2018 page does not show the link for the Dec 1 post Softball or Hardball that highlights the Equity P/C warning seen before the 2015 flash crash so I am adding it here.

As mentioned last week as the market rallied all week based on false hope and fake news tweets from our fearless (feckless) leader that a China trade detente (truce) was on the way, the end result was a stalemate or impasse that retraced all of the previous weeks gains and more.  Can some lawyer out there start a class action lawsuit with the SEC to reimburse all traders that have been whipsawed as a result of these fake news Trump tweets?  Musk after all was sued for $20 million.

Sentiment-wise bearish levels have risen slightly but remain well short of a BUY.  One possibility is a trading range between SPX 2600 and 2700 similar to the month long range of 2575 to 2675 from mid-Mar to mid-Apr, but lower levels testing the Feb lows at 2532 (2500-50) are ideal to set up positive divergences with the daily RSI and MACD.  As mentioned on Twitter the up/down cycles compared to midterm 2010 seem to be 8/9 days, so a trading low may be seen Dec 17/18 before the FOMC Dec 18/19.

I. Sentiment Indicators

The overall Indicator Scoreboard (INT term, outlook two to four months) sentiment has moved well above neutral, but only at the level near SPX 2700 in the Mar retracement.  I am beginning to wonder if sentiment will reach the Apr levels, however, since this is more consistent with a partial retrace (possible 2550 lows, 2875 retrace)


The INT view of the Short Term Indicator (VXX $ volume and Smart Beta P/C, outlook two to four months) shows somewhat higher ST bearish sentiment that may point to a pause for a couple days.


Bond sentiment (TNX) has now moved to a mildly negative outlook that may mean a consolidation at current levels similar to July.  A continued decline in sentiment will likely lead to higher rates.


For the INT outlook with LT still negative, the gold miners (HUI) saw a price breakout from the recent 140-50 range with the combined support of lower rates and a weak dollar even with weak bearish sentiment, but rates appear to be pausing so the price rise could be temporary.


II. Dumb Money/Smart Money Indicators

The Risk Aversion/Risk Preference Indicator (SPX 2x ETF sentiment/NDX ETF sentiment, outlook 2 to 4 days/wks) as an INT indicator has now risen back to neutral.  As pointed out early on the result of low sentiment would likely be under performance by the NDX compared to SPX and since Oct the NDX is down by almost 50% more.


The option-based Dumb Money/Smart Money Indicator as short/INT term (outlook 2 to 4 days/weeks) remains at very low levels indicating that downward price volatility is likely to remain high.


The INT term SPX Long Term/Short Term ETFs (outlook two to four weeks) bearish sentiment has now moved to neutral but remains well below the levels seen in the Mar-Apr retest.  Expect significantly lower prices now or later as the dumb money (2x ETFs) was largely unfazed by the current correction.


Long term neutral, the INT term NDX Long Term/Short Term ETF Indicator (outlook two to four weeks) remains in a range similar to Apr-Jun that may indicate a bottoming..


III. Options Open Interest

Using Thurs close, remember that further out time frames are more likely to change over time.  This week I will look out thru Dec 14.

With Fri close at SPX 2633, Mon has very light resistance up to 2650 if the market rallies, over 2650, 2670 seems posible.  Good support at 2600.  Light open int overall.


Wed open int is very light, but below SPX 2680, prices could drop to 2625.  A strong market could push to 2700.


Fri shows larger open int but puts dominate and could lead to higher volatility.  Below the large positions at SPX 2600, 2630 and 2680 may cause put writers to sell futures so these are likely to be inflection pts when crossed from above.  Lack of calls makes direction difficult to access, but above or below 2650 should go to next inflection pt..


IV. Technical / Other

Assuming the markets are a near a tradeable bottom, this is approximately what I expect based on the 2010-11 analog.  In this case, weaker sentiment than seen in Apr leads to a lower top mid-late 2019, making a H&S top with Jan and Oct of 2018.  What happens next is anybody's guess, but one political analyst discusses Trumps options if the China trade war drags on and concludes that a re-escalation is likely.  This could lead to an SPX 500 pt waterfall.


A prominent EW analyst also shows a similar projection for both time and price here.

Conclusions.  Last weeks option open int proved accurate as SPX 2750 was seen as a major inflection pt with above pointing to 2800 and below to 2700 or lower.  Sentiment is moving in the right direction for a bottom in a week to 10 days, and seems likely that the banksters will do everything they can to encourage the Fed to stop taking away the cookie jar, so a sharp decline from Fri/Mon/Tue below 2600 is the best way to achieve this.
 
Weekly Trade Alert.  The ST Indicator pts to a possible pause for a couple of days and one EW blogger sees this as a small triangle that breaks down at the EOW.  Ideally my targets for the bottom are Dec 17/18 at SPX 2500-50 setting up a positive divergence before the FOMC.  A strong EOY rally could follow.  Updates @mrktsignals.

Investment DiaryIndicator Primer,  update 2018.03.28  Dumb Money/Smart Money Indicators
Article Index 2018 by Topic
Article Index 2017 by Topic
Article Index 2016 by Topic
Long term forecasts

© 2018 SentimentSignals.blogspot.com