
Last weeks outlook was somewhat mixed with INT/LT indicators turning more negative while several ST/INT indicators were neutral to positive. The result was a 1% follow thru to the previous weeks run up on Mon followed by a sideways channel of about 1/2% for the rest of the week. ST/INT sentiment has now turned mostly negative although not yet reaching the Sell levels. Things seem to be lining up for more turbulence around mid-month again as we have seen for the past several months, but may not begin until after Sept options exp.
Tech/Other looks at two volatility indicators that show increasing risk of a ST pullback of 3-5%, while the INT/LT VIX Buy&Sell components indicator has turned up that may mean an extension of the topping process into year-end.
I may have to take a few weeks off from the weekly updates until mid-Oct as "crunch time" is approaching for the closing of the sale of my house. Will try to update occasionally on Twitter.
I. Sentiment Indicators
The INT/LT Composite indicator (outlook 3 to 6+ months) has three separate components. 1st is the SPX and ETF put-call indicators (30%), 2nd the SPX 2X ETF INT ratio (40%), and 3rd a volatility indicator (30%) which combines the options volatility ratio of the ST SPX (VIX) to the ST VIX (VVIX) with the VXX $ volume.
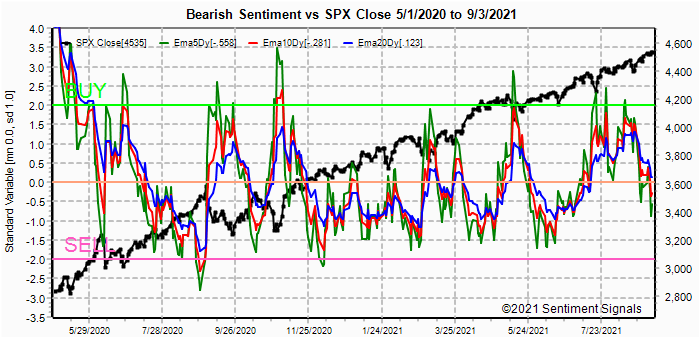
Switching back to the EMA view, the INT/LI Composite continues to hover at the extreme level of -2.0 SD, matching the lows of Dec 2019.

The ST Composite has reached a new extreme low for the last year near that seen of June 2020. The neutral position of the VXX $ Vol indicates that an expected decline over the next 1-4 weeks will not be as volatile. I am expecting a 3-5% pullback, likely starting after Sept options exp on 17th thru early Oct. This roughly matches Sept-Oct 2018.

Here we also see a matching level to the low sentiment of June 2020.

Looking only at the FOMO component, sentiment is at the bottom TL of a declining trend since mid-2020.

While looking at the EMA view shows that sentiment is rolling over more slowly that June 2020, and is more similar to the rounded tops of Feb and May of 2021, supporting a less volatile decline that may still be a week or two away.


Now up over 8% the last two weeks, the bearish ETF sentiment for the HUI (possibly the Avi effect) continued its rise last week and may support a further rise in prices toward 275-80 over the coming weeks.

II. Dumb Money/Smart Money Indicators
This is a new hybrid option/ETF Dumb Money/Smart Money Indicator as a INT/LT term (outlook 2-6 mns) bearish sentiment indicator. The use of ETFs increases the duration (term).
Bearish sentiment is mostly unchanged and remains near recent lows.

III. Options Open Interest
Using Thur closing OI, remember that further out time frames are more likely to change over time, and that closing prices are more likely to be effected. Delta hedging may occur as reinforcement, negative when put support is broken or positive when call resistance is exceeded. This week I will look out thru Sept 10.
With Fri close at SPX 4535, options OI for Tue is small, but the P/C is moderately high at 142%, so although prices may fall early toward 4500, a close between 4525-50 is likely.


IV. Technical / Other
The INT/LT a sharply higher SKEW has moved the spread with the VIX term structure to a more positive bias, following the Aug-Oct 2018 pattern. In June when the SKEW broke into the 160-170 area and people were calling it a "crash indicator", I first pointed out the contrarian view similar to Aug-Oct 2018 where a Sell signal was unlikely until the sentiment "gap" with the VIX/VXV dropped to 0.0. Currently we are seeing the same oscillations, only in slow motion that could possibly indicate a "stretching out" of the topping process into Dec.


Conclusions. A similar pattern of the past several months of a pickup in volatility around options exp Sept 17 seems to be indicated by current sentiment indicators. There also has been an alternation in size with the larger decline due for Sept and may create enough "seasonality phobia" to carry the SPX into the EOY as is indicated by the VIX Buy&Selll components.
Weekly Trade Alert. Possible narrow range next week (SPX 4500-50), before a "false" breakout to SPX 4550-600 opt exp week before a 3-5% decline into late Sept-early Oct. Updates @mrktsignals.
Investment Diary, Indicator Primer,
update 2021.07.xx Data Mining Indicators - Update, Summer 2021 (in progress),
update 2020.02.07 Data Mining Indicators,
update 2019.04.27 Stock Buybacks,
update 2018.03.28 Dumb Money/Smart Money Indicators
Article Index 2019 by Topic, completed thru EOY 2020.02.04
Article Index 2018 by Topic
Article Index 2017 by Topic
Article Index 2016 by Topic
Long term forecasts
© 2021 SentimentSignals.blogspot.com