Saturday, December 28, 2019

Record Euphoria, What Next?

The SPX continued to push higher last week, even as many bearish sentiment indicators pushed to new lows of the last several years.  Last week I turned cautiously bearish expecting an SPX 1-3% pullback over the next two weeks, but last week closed up about 20 pts.  One EW analysts that has been spot on for the last two weeks, calling for a wave 3 top on ES 3245-55 was Trader Joe.  Next, TJ sees a w4 pullback to SPX 3190-3200 which lines up with next week's SPX OI.  Likely to follow is w5 to 3250-80, possibly to coincide around some event as opt exp on 17th, China trade deal signing, or Trump's State of Union speech.

This week's Tech/Other shows a followup of the Rydex Bear/Bull ETF Ratio, now in between the Jan and Sept 2018 lows, and the Crash Indicator which shows a less bearish view.

I. Sentiment Indicators

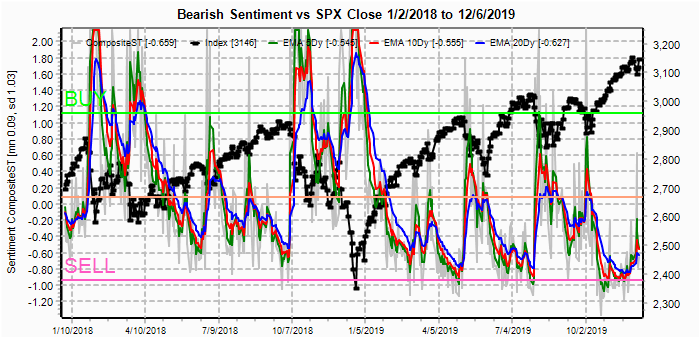
The overall Indicator Scoreboard (INT term, outlook two to four months) bearish sentiment has moved to the lowest level of the last two years (actually as far back as I could go, 2011).  We should be approaching a significant top.


The INT view of the Short Term Indicator (VXX $ volume and Smart Beta P/C [ETF Puts/Equity Calls], outlook two to four months) bearish sentiment has also moved to the lowest level of the last two years.


Bonds (TNX).  Interest rates were again turned down just below the 2.0% level, but the pattern of rising bottoms still supports higher rates, while sentiment remains extremely low.


For the INT outlook with LT still negative, the gold miners (HUI) came to life last week as the gold bugs are as resilient as Trump supporters, presumably due to talks of reflation after a China trade settlement, while bearish sentiment also remains extremely low.


II. Dumb Money/Smart Money Indicators

The option-based Dumb Money/Smart Money Indicator as short/INT term (outlook 2 to 4 mns/weeks) compared to other sentiment measures, options traders are still somewhat cautious and that may keep the rally going for a few weeks.


And the sister options Hedge Ratio sentiment is at levels comparable to other pullbacks, including the Oct 2018 10% decline, but we do not see crash levels similar to Jan or Dec 2018..


The INT term SPX Long Term (2x/DM) ETFs (outlook two to four weeks) bearish sentiment has now turned back down and may be tracing out a longer topping period as in Aug-Oct 2018.


The INT term NDX Long Term (2x/DM) ETFs (outlook two to four weeks) bearish sentiment has also turned back down.


Finally,a look at the 3X ETF ratio (TZA/TNA) for the RUT that has been outperforming lately and looks like it may make a double top around 1750, possibly due to hopes of a turnaround from China trade troubles.


III. Options Open Interest

Using Thur closing OI, remember that further out time frames are more likely to change over time, and that closing prices are more likely to be effected.  This week I will look out thru Jan 3 with Mon/Tue/Fri where Tue is EOM.  Also, This week includes a look at the GDX for Jan.

With Fri close at SPX 3240 after an early move up to 3248, Mon is somewhat similar to the last two weeks where there is little call resistance to higher prices up to 3270.  However, Fri late futures are showing weakness, so a move to 3225 is possible.


Tue, EOM, is decidedly more negative with large open int showing the potential for a move down to the SPX "straddle" at 3200 (last week I incorrectly called this a strangle which uses diff strikes).


For Fri (no jobs reports until Jan 10), there is moderate to large OI with call resistance down to 3190 and no current put support until SPX 3175.  Probably the best bet to hit 3200 or lower for the week.


Using the GDX (now 28.9) as a gold miner proxy.  Where Dec opt exp showed a range of 26-28 as likely (which held until last week after opt exp), Jan exp shows a somewhat higher range with very large call resistance at 30 and little net put support until 25.  Likely range 26-29.


IV. Technical / Other

A quick update of the Rydex Bear/Bull ETF Ratio shows a sharp spike lower last week below the 3.5% level, in between the Jan and Sept 2018 levels.  An INT top should be near.


The Crash Indicator seems to have bottomed in the area prior to the Aug 2019 pullback of SPX 200 pts, but below that of the initial Oct 2018 down leg of 10%.  This is consistent with a 7-10% pullback that may just be the initial leg of a larger decline as seen in Oct-Dec 2018.


Conclusions.  Last week's strong seasonal bias was able to power thru SPX OI call resistance to higher levels, but the most likely scenario still seems to be a 1-3% pullback (w4 from TJ) before a more important top around mid Jan (opt exp, trade agreement, State of Union).  The nature of the decline will likely become clearer after sentiment updates when normal trading returns.  VIX call buying remains stubbornly low, but it also did not spike before the "mini flash crash", then again can anyone predict Trump's Tweet storms (much like CA earthquakes).

Weekly Trade Alert.  Small pullback possible to SPX ~3200, then higher to mid Jan for INT top.  Updates @mrktsignals.

Investment DiaryIndicator Primer,  update 2019.04.27 Stock Buybacks, update 2018.03.28  Dumb Money/Smart Money Indicators
Article Index 2019 by Topic
Article Index 2018 by Topic
Article Index 2017 by Topic
Article Index 2016 by Topic
Long term forecasts

© 2019 SentimentSignals.blogspot.com

Saturday, December 21, 2019

Is the Fat Lady Singing?

Last year at this time, I indicated that I was expecting a low around SPX 2350 which was hit on Xmas eve and last week I indicated that I remained cautiously bullish, but a couple of events occurred last week that have now made me turn cautiously bearish.  First, the SPX ATHs on optn exp Fri saw an expansion in volume to about 2X avg daily volume, clearly some heavy distribution.  The last time we saw a similar volume expansion at an optn exp ATH was Sept 2018, which was followed by a small pullback then a slightly higher high two weeks later.  Second, the Rydex Bear/Bull ETF Ratio (see Tech/Other) just crossed below 7.5% for only the 2nd time the last two years, where the first was the Jan 2018 top and the second was Aug-Sep 2018.

My conclusion based on other sentiment measures is that we may be a couple of weeks away from a top in the SPX, but that there could still be several months before the beginning of a sharp downturn (similar to the rounded top of May 2015).  As summarized by ZeroHedge, "the bears have left the building".

I. Sentiment Indicators

The overall Indicator Scoreboard (INT term, outlook two to four months) bearish sentiment ST (grn) last week dropped to the lowest level seen in the past two years with the LT (blu) right behind.  Don't be surprised to see a 1-3% pullback before EOY with likely higher highs early Jan.


The INT view of the Short Term Indicator (VXX $ volume and Smart Beta P/C [ETF Puts/Equity Calls], outlook two to four months) bearish sentiment has also turned back down.


Bonds (TNX).  Interest rates moved somewhat higher last week from TNX 1.85 to 1.92% after a test of 1.95%.  The 200 SMA may act as resistance at 2%.  The Safety Trade Indicator (SPX/TNX) proved correct as both SPX and int rates moved higher.  Interestingly Avi Gilbert on Mon forecast a sharp drop in rates with the TLT testing its highs at 151, however, support at 136 was tested twice and if it fails his forecast is 125 or TNX 2.3-2.4%.

For the INT outlook with LT still negative, the gold miners (HUI) bearish sentiment saw a sharp drop at the end of the week while prices consolidated around 220 for no apparent reason.


II. Dumb Money/Smart Money Indicators

The option-based Dumb Money/Smart Money Indicator as short/INT term (outlook 2 to 4 mns/weeks) is quickly approaching its lowest level of the last two years with a ST spike similar to June 2018 that may mean a quick pullback, while higher SPX may produce sentiment similar to Dec 2018.


And the sister options Hedge Ratio sentiment is still not at extremes seen before crashes as in Jan and Dec 2018, but would allow a sizable pullback at any time.


The INT term SPX Long Term/Short Term ETFs (outlook two to four wks/mns) bearish sentiment (2x DM/3x SM) is continuing to decline sharply as the Smart money correctly anticipated the moves off the Dec 2018 and Oct 2019 lows, but sentiment has moved to a level comparable to the Jan 2018 highs..


The INT term SPX Long Term (2x/DM) ETFs (outlook two to four weeks) bearish sentiment continues to show a rounded bottom as seen in Jan 2018.


The INT term NDX Long Term (2x/DM) ETFs (outlook two to four weeks) bearish sentiment also continues to show the rounded bottom as in Jan 2018.


III. Options Open Interest

Using Thur closing OI, remember that further out time frames are more likely to change over time, and that closing prices are more likely to be effected.  This week I will look out thru Dec 27. With Wed a Xmas holiday and Tue a half day, Wed optns are moved to Tue.  Also, this week includes a look at the TLT for Jan.

With Fri close at SPX 3221, the options setup for the week is much like last week where Mon shows little call resistance at higher prices with stronger resistance later in the week.  The main difference is that overall sentiment is much more negative and any weakness early in the week will likely be amplified later in the week.

Tue strong call resistance at SPX 3225 is likely stop any rally if prices can't move higher on Mon.  A drop to SPX 3200 or lower is possible.


For Fri, the large "strangle" at SPX 3200 may keep prices around that level, but weakness could prices as low as 3150.


Currently the TLT is 136.6 with the TNX at 1.92%.  For Jan 17, put support should lift prices toward the 140 level that may indicate some weakness in stocks.  I do not expect much fireworks in bonds until the second half of 2020.


IV. Technical / Other

First the Rydex Bear/Bull ETF Ratio, which I have indicated several times as an excellent INT indicator for the last rwo years, has reached the SELL level of 7.5% with a lead time of two to four weeks.  However, there is no way to tell if an INT top is imminent as in Jan 2018 or if a more complex topping pattern will occur as in Jul-Oct 2018.


Looking at the volatility measures, SKEW and VIX options relative to CPC Revised, does appear to indicate a more prolonged topping pattern is likely.  This time I am starting in Jan 2018, but realize that VIX call levels are unlikely to match the Jan/Feb levels due to the blowup of short vol accts (incl optn writers).  First, the SKEW has recently risen dramatically, but remained high for several months before the Oct-Dec 2018 selloff.  Given the overall low bearish sentiment (CPC Revised), the likely cause is smart money accumulating OTM puts.


Next the last time the level of VIX put buying with SPX at a high matched today's level was Jan 2018.  If you remember the VIX actually rose even as the SPX moved higher.  It's doubtful the VIX moves much lower unless VIX put buying drops.


The one element that is still missing for an imminent sharp decline is VIX call buying.  This chart is distorted due to the Jan/Feb 2018 extremes, but I do expect something more like the Set-Oct 2018 levels before an INT decline (-1.5 SD vs now -.5 SD).


Conclusions.  Extremely low bearish sentiment in most of the indicators indicate that a top may occur at any time, and options are still the Jan-Feb sharp pullback and rally into the election or a rounded top that may extend into mid-year.  The choice of top may become clearer when the impeachment proceedings begin in Jan.  I think too much is being read into the delay in passing the decision to the Senate, as the most likely reason is to give everyone a two week break for Xmas.  A rounded top will probably be accompanied with an increase in volatility due to the high VIX put volume, but likely keep the SPX above 3000.

Weekly Trade Alert.  The next two weeks may be the best chance the bears have had for a few weeks, but don't expect more than a 1-3% pullback.  Updates @mrktsignals.

Investment DiaryIndicator Primer,  update 2019.04.27 Stock Buybacks, update 2018.03.28  Dumb Money/Smart Money Indicators
Article Index 2019 by Topic
Article Index 2018 by Topic
Article Index 2017 by Topic
Article Index 2016 by Topic
Long term forecasts

© 2019 SentimentSignals.blogspot.com

Saturday, December 14, 2019

The Trade War is Over, Trump Surrenders

President Trump began a trade war with China in Jan of 2018 by imposing a tariff on inexpensive solar panels (we don't believe in global warming anyway) and followed up with a broad range of tariffs in Mar, for which China retaliated in Apr with offsetting tariffs.  Now almost two years later (trade wars are easy to win), and faced with a slowing global economy and threats of impeachment, POTUS gives in to Chinese demands by agreeing to cancel future tariffs and cut existing ones by 50% to expedite a "weak and unenforceable" trade deal.

We immediately saw a 1%+ jump in stocks (SPX), but also a 2% drop in bonds (TLT).  The jump in stocks turned out to be a "sell the news", but the bigger implication may be from bonds.  Former NY Fed Pres Zoltan has been warning recently that the repo market may be close to collapse due to banks concentration of funds holdings in bonds in anticipation of QE4, but if the trade deal causes bond rates to spike would the Fed still start QE4 when the additional stimulus could cause rates to spike further?

Last week, I discussed two possible scenarios that looked equally likely (my preference was the second).  The first was a continued melt up setting up a repeat of 2018, where a sharp 1st  Q selloff leading to a spike in bearishness then a rally into the election with a Q4 or longer sharp decline, and the second was the rounded top (aka 2015) that may see a larger "flash crash" around May due to fallout from the Trump impeachment process (Trump resigns).  The key for impeachment is how long it drags on and it now appears that the GOP controlled Senate will push for an early vote before hearing evidence, much like a dismissal of charges before a trial or a vote of no confidence as we have seen over the past year with Johnson's Brexit.

As discussed below several indicators are showing similarities to the first week of Jan 2018.  This may mean that the GOP is expected to be successful in Jan, possibly pushing the SPX toward 3250-3300 in Jan before a sharp correction of 10% or more.  I have remained overall bullish since calling for lows near SPX 2350 late Dec 2018 and remain cautiously so.

I. Sentiment Indicators

The overall Indicator Scoreboard (INT term, outlook two to four months) bearish sentiment seems to be forming a rounded bottom similar to what was seen in Jan and Oct 2018, although the "mini flash crash" the previous week may be responsible.


The INT view of the Short Term Indicator (VXX $ volume and Smart Beta P/C [ETF Puts/Equity Calls], outlook two to four months) bearish sentiment is also showing an upward bias and is more like Jan 2018.


Bonds (TNX).  Interest rates continue to meander with an upward bias with extremely low bearish sentiment.  See the Safety Trade Indicator in DM/SM section for comparison to late 2016.


For the INT outlook with LT still negative, the gold miners (HUI) bearish sentiment continues to reflect that of int rates.


II. Dumb Money/Smart Money Indicators

The option-based Dumb Money/Smart Money Indicator as short/INT term (outlook 2 to 4 mns/weeks) bearish sentiment turned sharply lower last week after being mildly positive for the last few weeks.  We are now at levels comparable to the 1st week of Jan 2018.


And the sister options Hedge Ratio sentiment is following the DM/SM options indicator lower and the LT EMA (blue) has just reached the level of the 1st week of Jan 2018.


The INT term SPX Long Term (2x/DM) ETFs (outlook two to four weeks) bearish sentiment has also started climbing as was seen in Jan 2018.


The INT term NDX Long Term (2x/DM) ETFs (outlook two to four weeks) bearish sentiment is mimicking the SPX ETF indicator.


Finally, the Safety Trade Indicator (SPX/TNX ETFs) saw a large spike two weeks ago that generally happens after sharp SPX selloffs, representing panic moves into bonds and SPX bottoms.  As a paired trade, this could also mean a significant low in rates.  The only time I could find a "BUY level" when stocks were at or near a top was late 2016 when the TNX was trading between 1.4-1.6% and over the course of several months jumped to 2.6%.  This may be indicating the spike in rates predicted by Zoltan, a blow off in stocks, or a combo of both.


III. Options Open Interest

Using Thur closing OI, remember that further out time frames are more likely to change over time, and that closing prices are more likely to be effected.  This week I will look out thru Dec 20. Also, This week includes a look at the GDX for Dec.

With Fri close at SPX 3169, the SPX is comfortably over put support at 3100 and call resistance at 3150 (now likely to be support w/delta hedging).  Only minor resistance at higher levels may encourage an early week rally.


Wed shows moderate resistance at the SPX 3170 and 3200 that could push prices back to the 3150 area.


For Fri, shows even more resistance above the SPX 3150 levels and may push prices to the 3140-50 level.


Using the GDX as a gold miner proxy, last week saw the GDX bottom just below 27, rally back to 28+, then close at 27.7.  For Dec 20 exp, prices should stay between put support at 26 and call resistance at 28.


Currently the TLT is 139 with the TNX at 1.82%.  Prices were expected to stay within a 136 to 140 range last week with a high of 140 and a low of 136.6.

IV. Technical / Other

Due to Feb 2018 VIX blow out, VIX option data starts Mar 2018.  Last Fri saw a huge spike in VIX put buying at 4x avg daily volume that has preceded several tops of the last two years.  But as seen in the accompanying VIX call chart, VIX call buying has just risen to the avg daily level and is expected to see a significant rise before a significant decline in SPX.


VIX call volume just approaching avg.


Conclusions.  ST the China trade deal is done for now and focus is likely to  switch to the impeachment proceedings.  Here is a reasonably unbiased oped from NY Times, unless you believe all media is out to get Trump.  It looks more serious than most people recognize, although the causes may just be the arrogance of POTUS, who during the first two years fired over 60% of his staff and in some positions two or three times, until only "yes" people were left.

LT and possibly even ST, if Zoltans predictions are true, the bond market may turn out to be a major concern.  Several articles by the Humble Student (here and here) show that global growth has likely bottomed and this, combined with sentiment, could make the bond market particularly volatile.  Important factors are relative valuations and stock buyback reduction.

I have been looking for a sizable correction to start Jan-Feb and sentiment is starting to support that view.

Weekly Trade Alert.  The pullback last week was milder than expected and admittedly I underestimated Trumps ability to flip-flop on trade issues as I expect a resolution sometime in Jan.  The timing may be indicative of the seriousness of the impeachment proceedings since Trump now has more time to focus on his defense.  Limited upside and downside for now.  Updates @mrktsignals.

Investment DiaryIndicator Primer,  update 2019.04.27 Stock Buybacks, update 2018.03.28  Dumb Money/Smart Money Indicators
Article Index 2019 by Topic
Article Index 2018 by Topic
Article Index 2017 by Topic
Article Index 2016 by Topic
Long term forecasts

© 2019 SentimentSignals.blogspot.com

Saturday, December 7, 2019

Fine Tuning A Top

Several weeks ago, I pointed out that some of the volatility related indicators, as well as the Smart Beta P/C, were warning of the potential for a "mini flash crash" of 3 to 5% over a two to three day period, while others, the SPX 2x ETF ratio and Hedge ratio were showing potential for a mini melt up.  As it turns out, the melt up occurred first, hitting the top of my price target since Jan of 3100-50 for the SPX at 3154.

The volatility spike in last weeks "mini flash crash" could be compared to that of Mar 2015 and Aug 2017.  Both turned out to be "bear traps" where the SPX went on to make an INT top, two months later for 2015 (May) and five months later (Jan) for 2017.  Interestingly, both saw a sharper decline of 10%+ five months later in Aug 2015 and Jan-Feb 2018.  If history repeats, May of 2020 would be the timing target to start the next decline of 10%+.

Below is a chart of SPX 2015.  The circled area shows Mar 2015 where the 3% three decline was part of an overall 5% decline where a rally retraced all but a few pts of the entire decline in about the same amount of time as the decline.  What followed next was a higher retest of the lows that in today's market would be a gap fill at SPX 3093.  Will history repeat?


I. Sentiment Indicators

The overall Indicator Scoreboard (INT term, outlook two to four months) bearish sentiment showed only a weak reaction to last weeks early decline and does not support a very strong rally from here.


The INT view of the Short Term Indicator (VXX $ volume and Smart Beta P/C [ETF Puts/Equity Calls], outlook two to four months) bearish sentiment also only showed a small blip upward.


Bonds (TNX) bearish sentiment continued to fall last week although rates were mostly unchanged to higher for the week as investors seem to be fleeing the volatility of the stock market.


For the INT outlook with LT still negative, the gold miners (HUI) bearish sentiment remain mostly unchanged as were prices for the week.


II. Dumb Money/Smart Money Indicators

The option-based Dumb Money/Smart Money Indicator as short/INT term (outlook 2 to 4 mns/weeks) only showed a slight pickup in bearish sentiment somewhat similar to the pullback after the Sept 2018 top.


And the sister options Hedge Ratio sentiment is also in a similar position to the pullback after the Sept 2018 top..

The INT term SPX Long Term (2x/DM) ETFs (outlook two to four weeks) bearish sentiment remains in a downtrend similar to July of 2018.


The INT term NDX Long Term (2x/DM) ETFs (outlook two to four weeks) bearish sentiment  still shows the least bearish sentiment since 2017 and should cause under performance for the NDX.


III. Options Open Interest

Using Thur closing OI, remember that further out time frames are more likely to change over time, and that closing prices are more likely to be effected.  This week I will look out thru Dec 13. Also, This week includes a look at the GDX for Dec 20.

With Fri close at SPX 3146, down 8 pts for the week.  Last Mon/Wed showed strong call resistance at 3170-80 and put support at 3080, but I expected hedge support to hold prices up thru mid-week and instead, courtesy of Tweeter in Chief and Mon's weak PMI, weakness was shown early with hedging pulling prices up at the end of week.  This Mon, we see moderate call resistance at SPX 3150 and below that could pressure prices toward the 3110 area.


Wed also shows moderate call resistance at 3150 and not much put support until 3100 the 3050.


For Fri, we see more of the same.  As with Mon/Wed, as long as SPX prices remain below 3150, calls should pressure prices toward the 3100 put support area.  This lines up with the 2015 type retrace to the 3090 gap area, possibly starting early next week.


Currently the GDX is at $27 and is expected to stay in the range of 26-28.


IV. Technical / Other - N/A

Conclusions.  It is somewhat amazing that after 12 months, the SPX remains in a similar price pattern to the rally off the Oct 2014 lows, even though the timeline is much more elongated (at a little over 2x).  Last weeks volatility event lines up well with both the Mar 2015 and Aug declines which were followed 5 months later by a 10%+ decline after new ATHs.  Applying alternation, my best guess is still the rounded top scenario from 2015 where stocks may put in a top with the 2019 Q4 earnings reports Jan-Feb 2020.  The Trump impeachment proceedings may then have a stronger effect on the markets as most are dismissing any serious consequences due to a GOP controlled Senate, but if the proceedings stretch out more than a couple of months, more serious consequences become more likely.  A Trump resignation, putting Pence in charge well before the election could be used as a face saving outcome for the GOP, but could result in a Aug 2015 type stock melt down.

Weekly Trade Alert.  Whipsaws like we saw last week make it almost impossible to have any confidence in a prediction, but the most likely pattern seems to be a pullback to retest the lows around SPX 3090.  FOMC on the 10-11th may provide an excuse for a selloff since some seem to be expecting another rate cut.  Could we see a "turnaround Tuesday" optn exp week?  Updates @mrktsignals.

Investment DiaryIndicator Primer,  update 2019.04.27 Stock Buybacks, update 2018.03.28  Dumb Money/Smart Money Indicators
Article Index 2019 by Topic
Article Index 2018 by Topic
Article Index 2017 by Topic
Article Index 2016 by Topic
Long term forecasts

© 2019 SentimentSignals.blogspot.com