Saturday, July 28, 2018

De-FAANGed

Last week was not one of my best as I completely overlooked the ending 30+ pt rally in two days in the May topping process.  Comparing May to July we saw a 40+ pt rally before the decline started.  Many are expecting the decline to continue into next week, but there is a possibility that the rally may continue for another week and then start an even larger decline.  While the tech and small caps seem to have lost their luster as "safe havens" in the trade war, the DJIA has been gaining relative strength that could mean continuing easing of trade war concerns.  Two weeks ago China and the EU made an agreement to reduce trade tarrifs, and last week we saw the US and the EU reduce trade tensions.  China last week increased economic stimulus to bolster a faltering economy amid a sharply declining currency - is it possible they may be willing to wave a small white flag in the trade war?

I. Sentiment Indicators

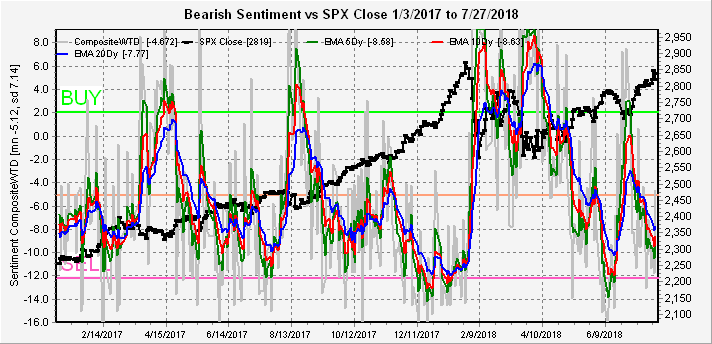
The overall Indicator Scoreboard (INT term, outlook two to four months) continued to fall thru Thur before a bounce on Fri.  Does this mean we will have a larger decline than May or will sentiment continue to decline setting up a bigger fall for the markets later?


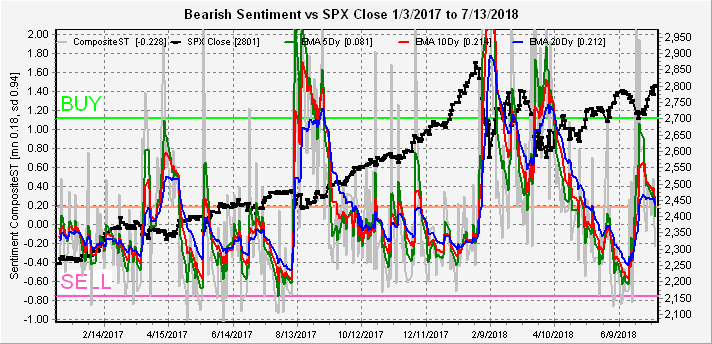
The ST view of the Short Term Indicator (VXX $ volume and Smart Beta P/C, outlook two to four weeks) has dropped below the level of the May top, and may be setting up a basing period similar to both Jan and June.


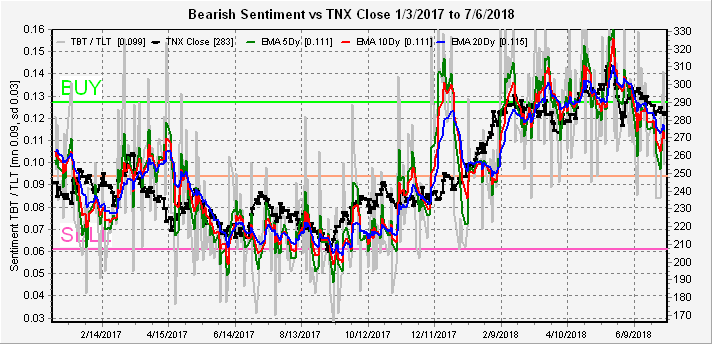
Interest rates (TNX) continued to rise last week, pausing just below the 3.0% level while bearish bond sentiment remained close to neutral.


For the INT outlook with LT still negative, the gold miners (HUI) bearish sentiment continued to fall last week even as prices moved lower.  Sentiment has now reached the level of Jul of 2017 but as I pointed out last week fundamentals are different this time where we not only have a strong dollar but also rising rates (TNX), not falling rates as in 2017.


II. Dumb Money/Smart Money Indicators

The Risk Aversion/Risk Preference Indicator (SPX 2x ETF sentiment/NDX ETF sentiment, outlook 2 to 4 days/hours) as a very ST indicator continues to fall reaching the SELL level both on Tue and Thur.  As pointed out last week the low absolute levels may be indicative of relative weakness for the NDX.


The option-based Dumb Money/Smart Money Indicator as short/INT term (outlook 2 to 4 days/weeks) rebounded sharply on Fri, falling just short of neutral, after a second SELL on Wed.  As noted with the ST Indicator, these multiple SELLs and rebounds can be indicative of a mini-meltup as in Jan as over-eager bears pounce on every decline causing the next rally  phase.


The INT term SPX Long Term/Short Term ETFs (outlook two to four weeks) continued to fall last week due to strong buying by the dumb money (2x) ETFs reaching a SELL mid-week.


The INT term NDX Long Term/Short Term ETF Indicator (outlook two to four weeks) rose last week due to strong selling by dumb money (2x) ETFs.


NDX 2x ETFs in 2018 have seemed to mark short term tops every time sentiment drops to neutral.


III. Options Open Interest

Last Fri as of Wed close showed call resistance down to SPX 2810 with put support at 2800 which caused me to post on Twitter Wed that Fri would likely see a drop down to 2810.


Using Thurs close, remember that further out time frames are more likely to change over time.  This week I will look out thru Aug 10.  Note last Fri strong down move is likely to increase put support for the week with the Mon data update.

Mon shows put support at SPX 2800 with potential for a push to 2820-30.


For EOM Jul 31, I am going to show both the Wed and Thur updates to show the increase in puts for the Wed SPX 10 pt drop.  Wed update,


Thur update, so for Mon data SPX puts at 2800 may have increased enough to hold prices above 2800.  Plus Jul 31-Aug 1 are FOMC, so may support prices.


For Wed FOMC, a lot of room to roam between SPX 2770 and 2830 with an expected close at 2800.


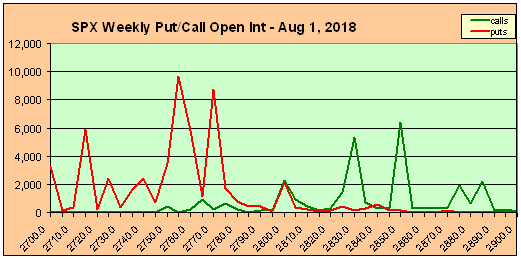
For Fri, the huge SPX call open int around 2875 dwarf other open int.  This is one thing that makes me wonder if someone is expecting trade concessions from China next week.  Note last Fri high open int at 2850 marked the top of the move on Wed.  Otherwise 2790-2800 is the expected close unless more puts were added on Fri's down move or are next week.


Following Fri the 10th, is the first really bearish looking chart where SPX 2800+ is strong resistance with little put support below.


IV. Technical/Other

You may want to read Avi Gilberts post from a week ago here where he was looking for an SPX top 2820-72 with chart here.  His downside target is 2650-2750 and I would expect something in between.  The question is whether one more pop to 2870 is possible.

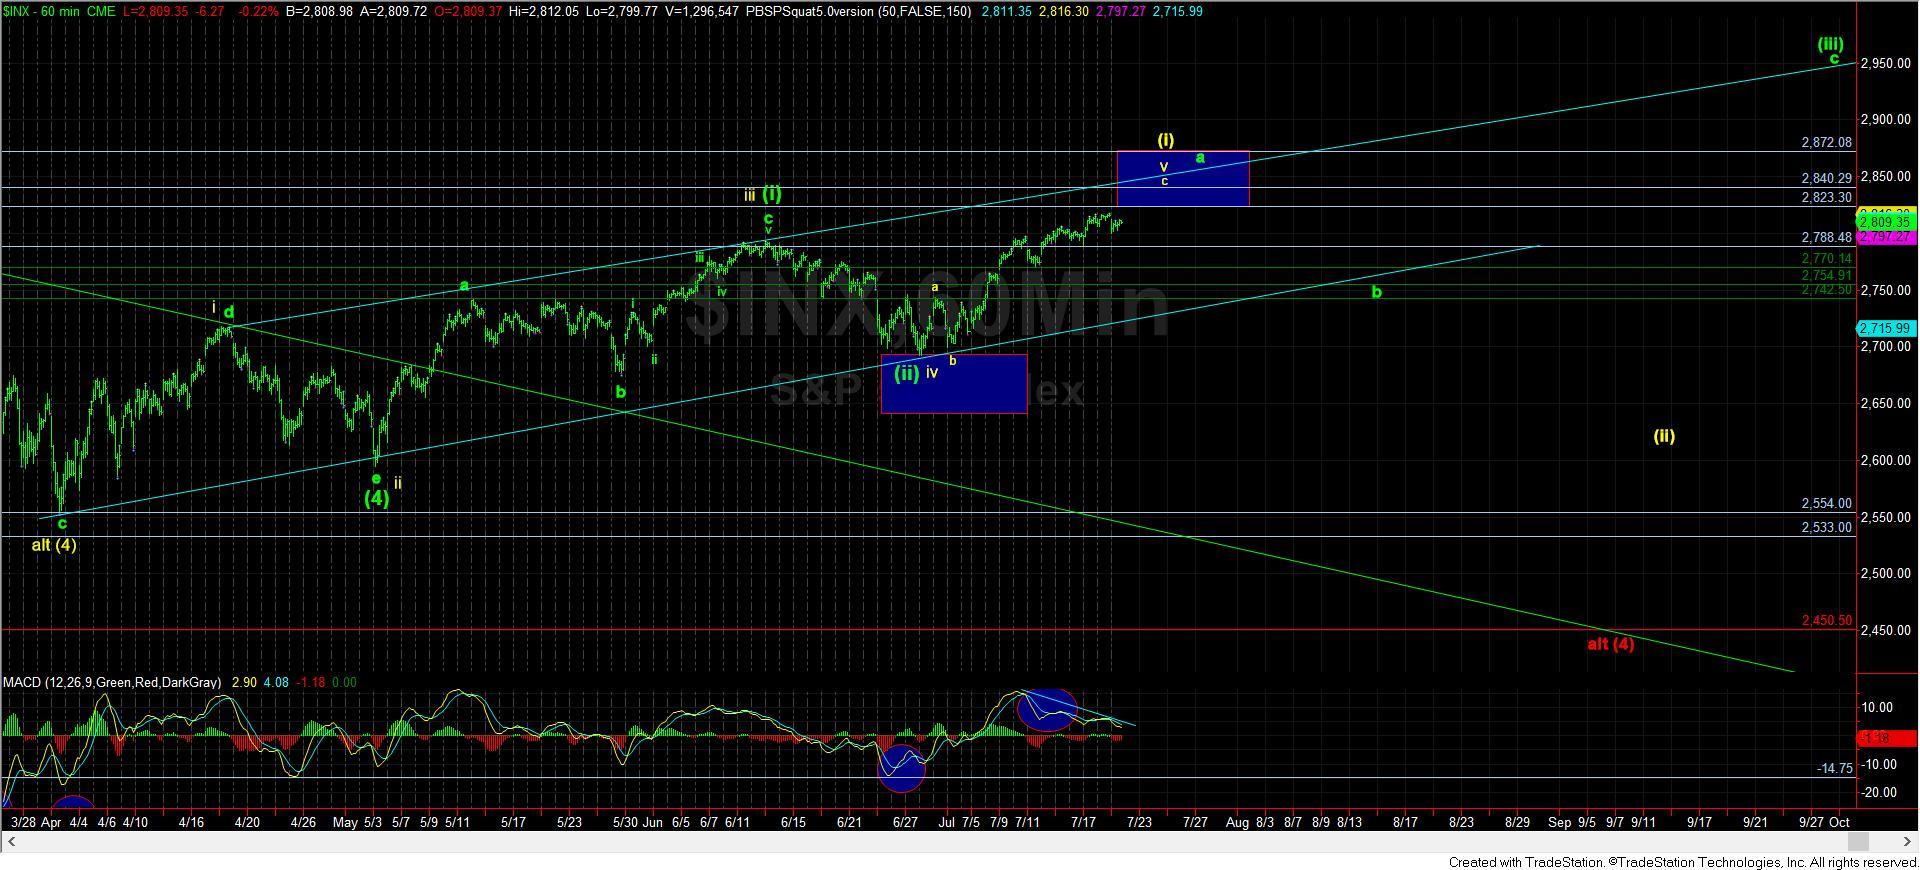
A short term view (these rarely work) is a H&S on the hourly SPX that does seem to fit the sentiment & options open int.  Here a move up to SPX 2830 the next day or two would be followed by a drop to 2800 then a few days consolidation above 2800 before a move lower.


Conclusions.  Last week did not go so well other than the Fri pullback.  My biggest problem was agreeing with the consensus looking for a pullback to SPX 2750-60 while the May 2018 analog said look for a "pop & drop".  The consensus still seems to be looking for a short pullback before a move higher which is why I prefer Avi Gilbert's outlook for a larger degree pullback, likely lasting into mid-late Sept due to uncertainty over the next rate hike.  Odds are in that the top is in at SPX 2850 matching the Nov 2015 1% below the previous high, but watch out for potential trade concessions from China that could push prices higher again.
 
Weekly Trade Alert.  Other than the possible H&S on the SPX very ST, my feeling is that last weeks SPX 40 pt drop Thu-Fri has increased put support enough to keep prices above 2800 for most of the week ahead.  Updates @mrktsignals.

Investment DiaryIndicator Primer,  update 2018.03.28  Dumb Money/Smart Money Indicators
Article Index 2018 by Topic
Article Index 2017 by Topic
Article Index 2016 by Topic
Long term forecasts

© 2018 SentimentSignals.blogspot.com

Saturday, July 21, 2018

Unintended Consequences

Last week's guidelines were looking for a top Wed/Thur for the SPX between 2820-30 and Wed high was 2817, so off by 3 pts.  Mon/Tue late day pullbacks kept the ST indicators from moving to SELLs until late in the week as were indicated in the Twitter updates.  So far the SPX options open int has done a good job in indicating that the SPX would hold over 2800, but that looks to change next week.

Friday's Trump tirade somewhat upstaged my "'unintended consequences" topic which is basically that Trump's trade war has lowered growth outlook for our trade partners, namely China, EU and Japan.  The result has been weakness in our partners currencies due to growth concerns and strength in the dollar.  Trump of course blames this on currency manipulation, but it is hard to believe that all three are colluding.  The "'unintended consequence" is that dollar strength offsets the effects of the tariffs.  Consider that initially one $US equals one EU.  You buy something that costs 100 EU and pay with 100 $.  Add a 10% tariff and the cost is 110 EU, but if the $US increases by 10% then 100 $ equals 110 EU and the price remains 100 $US.  The Urban Carmel makes an argument that the $US is topping, but I am not so sure.  A strong dollar will reduce the stagflationary effects of tariffs and also keep interest rates (TXN) low, while as we saw on Friday a weak dollar is likely to push int rates higher.

I. Sentiment Indicators

The overall Indicator Scoreboard (INT term, outlook two to four months) continued to fall, dropping below the May topping period which saw an SPX 70 pt drop.


After tweaking my software to make it easier graphing composites, I noticed that the ST view of the Indicator Scoreboard (ST, outlook two to four weeks) has done a good job of the monthly cycles in 2018.


The INT view of the Short Term Indicator (VXX $ volume and Smart Beta P/C, outlook two to four months) has also dropped to the level of the May top


It's hard to tell if Friday's jump in rates (TNX) was due to a falling dollar or low bearish bond sentiment.  My feeling is that continued dollar strength makes US T-bonds more attractive to foreign buyers, and less attractive for dollar weakness.


For the INT outlook with LT still negative, the gold miners (HUI) bearish sentiment fell sharply with high vol in NUGT on down days last week.  The last two times sentiment was this extreme was Jan and Jul of 2017.  The Jul rally was caused by a sharp drop in the dollar as seen here.  If the Urban Carmel is correct, the dollar may drop, but this not what I expect.


The Risk Aversion/Risk Preference Indicator (SPX 2x ETF sentiment/NDX ETF sentiment, outlook 2 to 4 days/hours) as a very ST indicator has now dropped down to close to the June SPX top on the longer EMAs and may be as low as it goes.  Now on SELL.


The option-based Dumb Money/Smart Money Indicator as short/INT term (outlook 2 to 4 days/weeks) dropped sharply Thur reaching the SELL level of May before rebounding Fri.


The INT term SPX Long Term/Short Term ETFs (outlook two to four weeks) fell sharply last week due to strong buying by the dumb money (2x) ETFs with the ST EMAs nearing the SELL level.  Considering the drop from recent highs close enough for a SELL.


Looking at the SPX smart money (3x) ETF sentiment back to 2015, seems to have bottomed half way between neutral and SELL.  Comparing this to Dec 2015, a spike lower seems necessary for a top, implying that a new high is likely after the next pullback.  Since the Nov 2015 high was within 1% of the May 2015 top, this could mean SPX 2850 for a larger top.


The INT term NDX Long Term/Short Term ETF Indicator (outlook two to four weeks) rose last week, but due to strong buying by smart money (3x) ETFs.  This is not as bullish as it seems as shown in the next chart.


The NDX smart money (3x) ETFs have been the last to buy into this rally and sentiment has now reached the level of early Nov 2015.  Other than the Aug 2015 flash crash, most significant pullbacks were preceded by SELLs.  Once dumb and smart money buy, everyone is "all in", so no one is left to buy.


III. Options Open Interest

Using Thurs close, remember that further out time frames are more likely to change over time.  This week I will look out thru the EOM, Jul 31.

 For Mon the SPX setup is similar to last week (2770-80) which ran to 2794, this time the large put hedge at 2800 should support prices into the close.  The calls at 2790 may cause a weak open, but the low call resistance below 2820 makes a run higher more likely.  Best guess is a small range 2800-10.


For Wed, SPX 2800 put support becomes call resistance where a move below 2800 finds first support at 2785 then 2760.


For Fri, very large call resistance above SPX 2810 may dampen prices during the week and the first large put support is 2750, and a close between 2750-75 is likely.


For Jul 31 EOM, has similar large open int below SPX 2800, where call resistance is likely to keep prices below 2780, and the hedges (overlaps) at 2750 and 2725 may act as magnets to pull prices lower.  Possible to see a washout as low as 2700 before recovery back toward 2750.


Conclusions.  While last week was expected to go nowhere, the next week and a half is likely to surprise to the downside.  SPX and NDX 3x ETFs indicate, however, that a final rally may be in the works before a larger correction.  The US dollar may hold the key to both inflation, interest rates and precious metals,  and although others are calling for a top in the US $, I am at least 60/40 leaning towards continued strength.  SPX options open int show downward guidelines after Mon with Wed targeting the 2760-85 range, Fri the 2750-75 range and Jul 31 EOM a likely 2700-50 washout.
 
Weekly Trade Alert.  Last week did not see the SELL setup expected, although a top was reached in the expected timeframe (Wed/Thu).  Next week should give a final shorting oppty in the SPX 2800-10 area with 2750-60 expected by Fri and possibly 2725 the following week. Updates @mrktsignals.

Investment DiaryIndicator Primer,  update 2018.03.28  Dumb Money/Smart Money Indicators
Article Index 2018 by Topic
Article Index 2017 by Topic
Article Index 2016 by Topic
Long term forecasts

© 2018 SentimentSignals.blogspot.com

Saturday, July 14, 2018

Fast Track to Nowhere

Last week got off on a fast track to SPX 2800 on Mon as indicated by the options open int, but only managed another 8 pts for the rest of the week to close at 2801.

Looking at the SPX since March, we have seen a monthly pattern that shows a rally into the mid-month followed by a decline thru the end of month.  This may be due to the monthly withdrawal of liquidity by the Fed thru the unwinding of QE by the reduction of the Fed's balance sheet.  Trump's tax cuts may be offsetting the effects on the economy, especially the corporate sector.  Starting the end of July, QE reduction increases from $30 to $40 billion a month and up to $50 billion in Sept, but Trump is not proposing additional tax cuts until later in the Fall.  This leaves EOM Jul - Sep as a potential bumpy period where additional stimulus withdrawal is not offset by a sugar fix.  Add potential trade war blowups and it could be a high risk period.

I. Sentiment Indicators

The overall Indicator Scoreboard (INT term, outlook two to four months) continued to fall last week, dropping below the mean, but continued SPX consolidation with an upward bias is likely before sentiment drops to at least the mid-May levels and before a sizable SPX pullback.  The DJIA is still in a "triangle" with the Feb and May high TL showing 25,250 as a possible ST top.  This could mean SPX 2820-30 before a pullback to 2750ish.


The INT view of the Short Term Indicator (VXX $ volume and Smart Beta P/C, outlook two to four months) is in a similar position to the Indicator Scoreboard.


Bearish bond sentiment (TNX) continued to show intra week spikes lower in bond sentiment which I am wondering if there is an effect of the Thurs weekly bond auction.  In any case, a continued sentiment decline may not see rates for the TNX fall much lower than 2.7% before reaching a SELL.


For the INT outlook with LT still negative, the gold miners (HUI) rally was short-lived as bearish sentiment fell, pulling prices down.


II. Dumb Money/Smart Money Indicators

The Risk Aversion/Risk Preference Indicator (SPX 2x ETF sentiment/NDX ETF sentiment, outlook 2 to 4 days/hours) as a very ST indicator continues to remain in low/neutral territory, and may be warning of a weakening of the out performance by the NDX.


The option-based Dumb Money/Smart Money Indicator as short/INT term (outlook 2 to 4 days/weeks) continues to hang around the neutral area.


The INT term SPX Long Term/Short Term ETFs (outlook two to four weeks) fell sharply last week with the ST EMAs reaching neutral, but not low enough to expect a pullback soon.


While the SPX 2x ETF sentiment continued to fall below the neutral area and is nearing the mid-May level that saw an SPX pullback of 60 pts.


The INT term NDX Long Term/Short Term ETF Indicator (outlook two to four weeks) fell sharply last week as the NDX made new highs.  Comparing sentiment to Jun-Jul of 2017. the NDX could be nearing a consolidation period.


While the NDX 2x ETF sentiment remains elevated, it has dropped by an equivalent amount to the Feb-Mar rally, so may need a cooling off period.  An INT top does not seem to be in sight.


III. Options Open Interest

Last Mon did see the potential delta hedging by SPX puts over 2775 that carried to near the 2800 resistance, and surprisingly the strength carried over into Fri where strong call resistance at 2800 was also overcome.

Using Thurs close, remember that further out time frames are more likely to change over time.  Next Mon has small open int, but the setup is similar to Fri where a hold over SPX 2795 can remain between 2800 and 2825, but a move below 2795 could drop to 2780.


For Wed,  the main difference is that large put support drops to 2765 with large call resistance at 2825.


For Fri, I usually don't post the SPX AM monthlies because they are usually hedged (overlap), but this month is different.  Here we see huge unhedged calls at SPX 2800 and partially unhedged calls at 2775 that are likely to push prices to the 2775 level or lower.


Fri weekly PMs are much the same where the expected close is SPX 2775.


The next large open positions are the following Fri and EOM.  The 27th shows large SPX call resistance over 2775 and modest put support at 2750.  Expected range 2750-75.


For the 31st, the configuration is similar to the 27th but with larger open int.  Additional calls at 2740 and 2750 could act to push prices as low as 2725.  Expected range 2725-75.


Conclusions.  Regular sentiment (INT) is nearing the levels prior to a small pullback similar to May, but DM/SM sentiment (very ST) is still neutral.  However, SPX options open int is showing a pullback could start by Fri and continue thru the EOM that could carry down to the SPX 2750 level or lower.  Optimally the market will continue to hold over SPX 2800 and may approach 2820-30 by Wed/Thur allowing the DM/SM Indicators to generate a SELL before a pullback begins.
 
Weekly Trade Alert.  Will be looking for shorting oppty at SPX 2800+ depending on confirmation by DM/SM Indicators..  Updates @mrktsignals.

Investment DiaryIndicator Primer,  update 2018.03.28  Dumb Money/Smart Money Indicators
Article Index 2018 by Topic
Article Index 2017 by Topic
Article Index 2016 by Topic
Long term forecasts

© 2018 SentimentSignals.blogspot.com

Saturday, July 7, 2018

Summer Doldrums for a While

Last weeks call was almost perfect with an opening decline down to SPX 2700 (2699) and a rally for the rest of the week with early intra day choppiness to finish slightly ahead of the target zone of SPX 2750-60 (2762).  If the analog for Nov-Dec 2015 continues to hold, the next 4 to 6 weeks should show a period of relative calm as the bears capitulate and the bulls become more complacent before a period of increasing volatility followed by a major breakdown.

I. Sentiment Indicators

 The overall Indicator Scoreboard (INT term, outlook two to four months) declined sharply last week as the market rallied, but remains above the mean.  As we saw in the Nov-Dec 2015 period, high put/call ratios and other sentiment may stay elevated for several weeks, but should fall sharply before any significant decline.


The INT view of the Short Term Indicator (VXX $ volume and Smart Beta P/C, outlook two to four months) is in a similar position to the Indicator Scoreboard.


Bearish bond sentiment (TNX) saw a sharp decline early in the week as trade war fears prevailed then rose towards the end of the week.


For the INT outlook with LT still negative, the gold miners (HUI) bearish sentiment rose with prices.


II. Dumb Money/Smart Money Indicators

The Risk Aversion/Risk Preference Indicator (SPX 2x ETF sentiment/NDX ETF sentiment, outlook 2 to 4 days/hours) as a very ST indicator continues to remain in neutral territory (TL), and is possibly starting an upward trend similar to late 2015.


The option-based Dumb Money/Smart Money Indicator as short/INT term (outlook 2 to 4 days/weeks) declined sharply towards the neutral area.


The INT term SPX Long Term/Short Term ETFs (outlook two to four weeks) remains elevated, showing that bearish sentiment in the dumb money (2x) ETFs remains high relative to the smart money (3x) ETFs.


While the SPX 2x ETF sentiment fell sharply toward the neutral area after rising to the level of Dec 2015.  This sentiment should fall toward the SELL level before the next significant decline.


The INT term NDX Long Term/Short Term ETF Indicator (outlook two to four weeks) remains elevated, but comparing to Dec 2015 below, may not mean a lot as far as further price gains.


Comparing the NDX sentiment above to 2015, the high level of 2x/3x ETF bearish sentiment was high in Dec 2015, but fell sharply before the Jan 2016 downturn.


III. Technical Indicators, Other

This week I want to take a look at a new composite of technical indicators that I may show from time to time.  This combines the NYMO, TRIN and NYAD+NYUD using the standard variable approach with mean equal 0.0 and SD of 1.0.  For 2018, it has done a better job of indicating tops than bottoms and now has reached the SELL level.  Since most of the indicators are near neutral, my feeling is that a consolidation like mid-May is likely.


 IV. Options Open Interest

For some reason, unlike other options that have the large positions on monthly expiration, the SPX seems to have large positions 2 or 3 times a month with July being the 6th, 13th and 27th.  So today I am going to start by looking at the 13th and 27th since large positions often mark significant price levels (last week the 6th showed an expected range of 2725 to 2750).  Remember that further out time frames are more likely to change over time.

For the 13th using Thurs close, the indications are pretty much the same as the 6th with support at SPX 2700 and 2725 and resistance at 2750 and 2775.  Overlaps between 2725 and 2750 may contribute to volatility and a move over 2760 can cause delta hedging to 2775.


For the 27th, large call positions make an advance over SPX 2775 unlikely, while there is little "pure" put support until 2700.  The large overlap at 2740 makes it the expected close, but more downside volatility is likely that on the 13th.  Overall this supports the Nov/Dec 2015 analog with near consolidation and late month volatility.


For Mon the 9th, reliability is somewhat low due to small open int, but puts at SPX 2760 and 2770 may push prices higher.  A move over SPX 2775 can cause delta hedging to 2800, likewise a move below 2760 may cause negative delta hedging.


For Wed 11th open int is much larger, especially with call resistance at SPX 2760, 2810 and 2820.  If Mon is up strong the 2760 calls will act to keep prices higher with little resistance to 2800, but a Mon close below 2760 will have trouble advancing.


Conclusions.  Most sentiment has dropped from BUY levels to neutral, but the Technical Indicator composite has moved to a SELL with a likely result of a consolidation similar to the 2015 analog.  Options open int, however, does show the potential for a "pop and drop" moving to the SPX 2800 level early in the week, but likely Mon/Wed offset for a tight range.

Weekly Trade Alert.  None.  More upside is possible, but is considered very "iffy" at this point.  Would rather wait for shorting opportunities later in month.  Updates @mrktsignals.

Investment DiaryIndicator Primer,  update 2018.03.28  Dumb Money/Smart Money Indicators
Article Index 2018 by Topic
Article Index 2017 by Topic
Article Index 2016 by Topic
Long term forecasts

© 2018 SentimentSignals.blogspot.com