
I. Sentiment Indicators
The overall Indicator Scoreboard (INT term, outlook two to four months) declined sharply last week as the market rallied, but remains above the mean. As we saw in the Nov-Dec 2015 period, high put/call ratios and other sentiment may stay elevated for several weeks, but should fall sharply before any significant decline.

The INT view of the Short Term Indicator (VXX $ volume and Smart Beta P/C, outlook two to four months) is in a similar position to the Indicator Scoreboard.

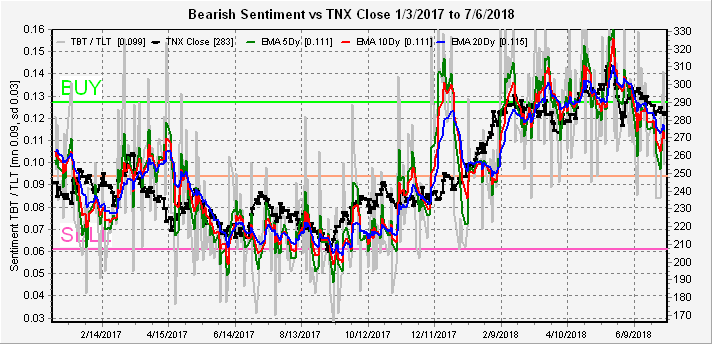
Bearish bond sentiment (TNX) saw a sharp decline early in the week as trade war fears prevailed then rose towards the end of the week.
For the INT outlook with LT still negative, the gold miners (HUI) bearish sentiment rose with prices.

II. Dumb Money/Smart Money Indicators
The Risk Aversion/Risk Preference Indicator (SPX 2x ETF sentiment/NDX ETF sentiment, outlook 2 to 4 days/hours) as a very ST indicator continues to remain in neutral territory (TL), and is possibly starting an upward trend similar to late 2015.

The option-based Dumb Money/Smart Money Indicator as short/INT term (outlook 2 to 4 days/weeks) declined sharply towards the neutral area.

The INT term SPX Long Term/Short Term ETFs (outlook two to four weeks) remains elevated, showing that bearish sentiment in the dumb money (2x) ETFs remains high relative to the smart money (3x) ETFs.

While the SPX 2x ETF sentiment fell sharply toward the neutral area after rising to the level of Dec 2015. This sentiment should fall toward the SELL level before the next significant decline.

The INT term NDX Long Term/Short Term ETF Indicator (outlook two to four weeks) remains elevated, but comparing to Dec 2015 below, may not mean a lot as far as further price gains.

Comparing the NDX sentiment above to 2015, the high level of 2x/3x ETF bearish sentiment was high in Dec 2015, but fell sharply before the Jan 2016 downturn.

III. Technical Indicators, Other
This week I want to take a look at a new composite of technical indicators that I may show from time to time. This combines the NYMO, TRIN and NYAD+NYUD using the standard variable approach with mean equal 0.0 and SD of 1.0. For 2018, it has done a better job of indicating tops than bottoms and now has reached the SELL level. Since most of the indicators are near neutral, my feeling is that a consolidation like mid-May is likely.

IV. Options Open Interest
For some reason, unlike other options that have the large positions on monthly expiration, the SPX seems to have large positions 2 or 3 times a month with July being the 6th, 13th and 27th. So today I am going to start by looking at the 13th and 27th since large positions often mark significant price levels (last week the 6th showed an expected range of 2725 to 2750). Remember that further out time frames are more likely to change over time.
For the 13th using Thurs close, the indications are pretty much the same as the 6th with support at SPX 2700 and 2725 and resistance at 2750 and 2775. Overlaps between 2725 and 2750 may contribute to volatility and a move over 2760 can cause delta hedging to 2775.

For the 27th, large call positions make an advance over SPX 2775 unlikely, while there is little "pure" put support until 2700. The large overlap at 2740 makes it the expected close, but more downside volatility is likely that on the 13th. Overall this supports the Nov/Dec 2015 analog with near consolidation and late month volatility.

For Mon the 9th, reliability is somewhat low due to small open int, but puts at SPX 2760 and 2770 may push prices higher. A move over SPX 2775 can cause delta hedging to 2800, likewise a move below 2760 may cause negative delta hedging.

For Wed 11th open int is much larger, especially with call resistance at SPX 2760, 2810 and 2820. If Mon is up strong the 2760 calls will act to keep prices higher with little resistance to 2800, but a Mon close below 2760 will have trouble advancing.

Conclusions. Most sentiment has dropped from BUY levels to neutral, but the Technical Indicator composite has moved to a SELL with a likely result of a consolidation similar to the 2015 analog. Options open int, however, does show the potential for a "pop and drop" moving to the SPX 2800 level early in the week, but likely Mon/Wed offset for a tight range.
Weekly Trade Alert. None. More upside is possible, but is considered very "iffy" at this point. Would rather wait for shorting opportunities later in month. Updates @mrktsignals.
Investment Diary, Indicator Primer, update 2018.03.28 Dumb Money/Smart Money Indicators
Article Index 2018 by Topic
Article Index 2017 by Topic
Article Index 2016 by Topic
Long term forecasts
© 2018 SentimentSignals.blogspot.com
If you’re familiar with trading you probably know that the
ReplyDeletesecret to making good returns is knowing how to pick the
right stocks.
Check it out here: https://lr189.isrefer.com/go/sqstr/artecharvey