Saturday, November 28, 2020

Is BTC a Harbinger/Omen?

I am not sure how many of you pay attention to Bitcoin (BTC), but it as been on a tear since the Sept stock market correction, more than doubling from the $9000 level.  I view it as more of a novelty, but possibly an indicator of excess liquidity.  Over the last few weeks there have have been several indications of tightening of the credit markets in China, and the Turkey Day massacre of BTC (-10%+) has me wondering of what's to come.  In Nov 2018, while the SPX was consolidating after it's Oct drop of about 10%, BTC fell 40% and only a month later in Dec the SPX started a 20% decline.  A continued drop in BTC may be a warning.

Last week I was looking for a move back up into the SPX 3620-70 zone by early Dec on "vaccine news", and Moderna's announcement Mon accelerated the move up, hitting my target by Tue with follow thru in Fri to 3645.  One of the timing gurus is predicting a swing high Mon/Tue.  SPX options OI is also showing strong call resistance for jobs report Fri, while Dec EOM is showing a huge call position at 3510&15 of 65k calls, eerily similar to my Sept 19 warning of a huge call position at 3225 of 30k calls right before the late Sept selloff.

On a lighter note, MW has an article by Jeremy Siegel, a respected academic know for predicting DJIA 20k in 2015, is now predicting a good 2021 with 40k in 4-5 years.  Unfortunately the article forgot to mention that his original prediction July 2015, was that the DJIA would reach 20K by the end of 2015, one month before the Aug flash crash of 15% down from 18k and then a second 15% decline starting Dec after a sharp rebound.  Early 2017, the DJIA did finally reach 20K, so I agree 40K is likely sometime, but it may take twice as long and could be a very rocky road.


I. Sentiment Indicators

The overall Indicator Scoreboard (INT term, outlook two to four months) bearish sentiment continued to fall last week and remains consistent with an INT top.


The INT view of the Short Term Indicator (VXX $ volume and Smart Beta P/C [ETF Puts/Equity Calls], outlook two to four months) bearish sentiment fell sharply early in the week now below that of the Feb SPX highs. (due to VXX $ Vol below).


The VXX $ Vol fell sharply as volatility players seem to be finally giving up.


Bonds (TNX).  Bearish sentiment in bonds is mostly unchanged.


For the INT outlook with LT still negative, the gold miners (HUI) bearish sentiment is also virtually unchanged even as prices broke below the lower TL.  A retest of the TL around 300 (known as the "kiss of death") is possible before further downside.


II. Dumb Money/Smart Money Indicators

The option-based Dumb Money/Smart Money Indicator as short/INT term (outlook 2 to 4 mns/weeks) bearish sentiment has turned back down now somewhat lower than the Feb top.


And the sister options Hedge Ratio bearish sentiment has finally joined the party as the second move over SPX 3600 has convinced (or fooled) hedgers that the rally is for real, and is now comparable to the Feb top.


The INT term SPX and NDX ETF sentiment is covered in the Tech/Other section using the new data mining indicators.


III. Options Open Interest

Using Thur closing OI, remember that further out time frames are more likely to change over time, and that closing prices are more likely to be effected. Delta hedging may occur as reinforcement, negative when put support is broken or positive when call resistance is exceeded.   This week I will look out thru Dec 4 & EOM. Also, this week includes a look at the TLT for Dec exp. 

With Fri close at SPX 3638, options OI for Mon is moderate with an even P/C.  Put support/call resistance is 3580/3650 with a slight negative bias into the close toward 3625.


Wed has smaller OI where SPX support resistance is 3550/3625 with a slight positive bias over 3600 due to elevated P/C. (Note Dev = Dec, my typo).


For jobs report Fri SPX OI positions are moderate with a fairly strong negative bias to below 3575, but the many overlapped hedges between 3500 and 3650 make directionality uncertain.


For DEC 31 EOM, it's early as many puts are added a few days before exp, but currently the extreme low P/C and very large calls positions at SPX 3510&15 of 65k can result in strong negative delta hedging (gamma) similar to what happened late Sept with 30k calls at 3225.


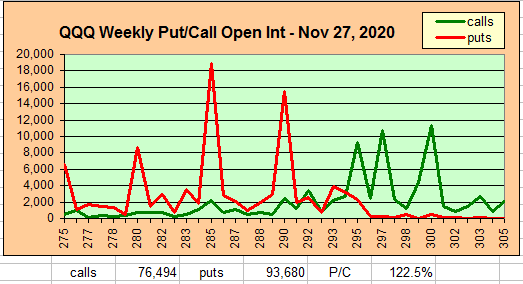
For the QQQ (NDX/41, 12k=293), closing at 299, tere is very little put support down to the 270s with strong call resistance at 300.  The NDX may start to fade by mid-month, but strength in cyclicals (DJIA) may hold up the SPX.


Currently the TLT is 160.2 with the TNX at 0.84%, minor support/resistance zones are 158.5/161.5, moderate 155/166.5 and major 152/170.  I expect a trading range for TNX of about .75% to .95% until Feb when a new stimulus package may pressure rates higher.


IV. Technical/ Other

For the SPX ETF sentiment, I am going to look at the term structure or SSO ETF spread to the CPCRev calls and hedge ratio or SSO spread to ETF calls.  First for the term structure, we've seen a pattern of lower and lower sentiment followed by lower prices since 2018.  Last week made a new low, exceeding the Sept top.


While the SPX hedge ratio, hedging has been on the increase since the Feb 2018 volatility spike which may be an indicator of less volatile declines.  However, the recent decline matches the Sept and exceeds the Feb top.


For the NDX ETF sentiment, I am going to look at the term structure or QLD ETF spread to the equity calls and hedge ratio or QLD spread to ETF calls.  Here, we also see increasing lows for the term structure followed by lower prices with the current level well below any previous sentiment.


While for the NDX hedge ratio, we are also seeing a pattern of increasing hedging and although below the Sept lows still higer than at other INT tops.


Conclusions.   Every thing seems to be pointing to an important top in the SPX as early as next week, although the recovery theme is likely to provide support for a couple more weeks.  A repeat of the Dec 2015 analog is also looking more likely with the contrarian view to Jeremy Siegel's bullish call similar to the call prior to the Aug 2015 flash crash as well as the EOM SPX options OI negative gamma outlook similar to Sept.  If there is a sharp decline into Feb 2021, it will likely be reversed when a stimulus package comes out.

Weekly Trade Alert.   A high is likely early next week, possibly near SPX 3650 to match the O/N high Tue (FX) at 3658.  SPX options is showing the potential for a decline to below 3600 by Fri.  Updates @mrktsignals.

Investment DiaryIndicator Primer,
 update 2020.02.07 Data Mining Indicators,
 update 2019.04.27 Stock Buybacks,
 update 2018.03.28 Dumb Money/Smart Money Indicators

Saturday, November 21, 2020

A Tug of War

Last week I was looking for a top in the SPX 3620-70 area before a pullback of 3-5% into the EOM as low as 3450-500, and Mon gapped up, topping near 3630 with a low just above 3540 or -2.5%. Sentiment is mixed with Tech Indicators (Tech/Other) showing extreme overbought and overall bearishness declining, but moderate hedging seems to be supporting the market for now. I am getting a deja vu feeling to Dec 2015 and Dec 2007 where most analysts were predicting strong 1st halfs the next year, but both started with Jan-Feb declines of 15%+/-.

The Tech/Other section includes an update of equity puts&calls that shows an uptick in speculation, the Tech indicator composite that shows extreme complacency, and a LT indicator, the NYUPV/NYDNV, that shows an almost identical setup to 2008.


I. Sentiment Indicators

The overall Indicator Scoreboard (INT term, outlook two to four months) bearish sentiment fell sharply last week, even with market weakness, and is now lower than the Feb 2020 top.


The INT view of the Short Term Indicator (VXX $ volume and Smart Beta P/C [ETF Puts/Equity Calls], outlook two to four months) bearish sentiment also turned down sharply and now equals the Feb 2020 top.


The VXX $ Vol also fell, now matching the Feb and Oct 2020 tops.


Bonds (TNX).  Bearish sentiment in bonds remains virtually unchanged as rates retreated modestly.


For the INT outlook with LT still negative, the gold miners (HUI) bearish sentiment remains near the recent lows, even with an 8% pullback to the lows of the week.  Gold bugs seem to be clinging to the hopes of a "bull flag" similar o Jun-July, but GDX options OI is showing little put support, and a breakdown below the lower TL could result in a selling panic down to 250ish.


II. Dumb Money/Smart Money Indicators

The option-based Dumb Money/Smart Money Indicator as short/INT term (outlook 2 to 4 mns/weeks) bearish sentiment is hovering near the Feb 2020 level.


And the sister options Hedge Ratio bearish sentiment on a ST basis is somewhat elevated compared to other sentiment, but INT term is the lowest of the past three years .


The INT term SPX Long Term (2x/DM) ETFs (outlook two to four weeks) bearish sentiment has fallen sharply to below the Feb 2020 top.  Data mining - term structure SSO/CPCRev calls, and hedge ratio SSO /ETF calls are nearing levels of Sept top.


The INT term NDX Long Term (2x/DM) ETFs (outlook two to four weeks) bearish sentiment is similar to the Sept top.    Data mining - term structure QLD/Equity calls, and hedge ratio QLD /ETF calls are nearing levels of Sept top.

III. Options Open Interest

Using Thur closing OI, remember that further out time frames are more likely to change over time, and that closing prices are more likely to be effected. Delta hedging may occur as reinforcement, negative when put support is broken or positive when call resistance is exceeded.  This week I will look out thru Nov 30. Also, this week includes a look at the GDX for Dec exp. 

For last Fri close there was a sharp pickup in put OI with the SPX 3558 closing right at support.


With Fri close at SPX 3558, options OI for Mon has the potential to drop to the 3525 level, but puts in the 3540-50 level are likely to push prices up to towards the 3550 level by the close.


Wed has somewhat larger OI, especially at SPX 3400, where SPX has small put support up to 3525 and larger support at 3450 then 3400.  A decline to near 3450 is possible with negative momentum.


For Fri SPX OI is moderate, but a lot of overlap between 3400 and 3600 creates a confusing pattern, but 3450-3500 seems most likely.


With the EOM Nov 30, the following Mon has the largest OI with strong put support up to 3575.  This could either contribute to a positive bias to next week (lows in the 3500-3550 area), or be a setup for a strong post holiday rebound on surprise news (perhaps FDA emergency approval of a c-virus vaccine or stronger than expt BF sales).  Either way a push to 3575-3600 is likely.


For the QQQ (NDX/41, 11.9k=290), closing at 290.4, there is strong put support at 290 and 285.  Weak ETF and data mining indicators may lessen support.


Using the GDX as a gold miner proxy closing at 35.9, there is small put support up ro 37 with strong call resistance at 40.  With low ETF sentiment, there is a real risk of panic selling if the 34-5 area breaks down.


Currently the TLT is 161.5 with the TNX at 0.83%. 


IV. Technical / Other

The equity puts and calls saw a pickup in speculative call volume (FAAMNGs) as news of increasing spread of the c-virus has propped up the tech sector.


The Tech Indicator composite (NYMO+TRIN+NYAD+NYUD) is now showing extreme complacency, especially with last week's decline.


While the LT chart for the NYSE adv/dec volume (NYUPV/NYDNV) would typically be a positive indicator compared to the last 5 to 7 years, but looking back to 2005, we see a long basing period where the first breakout is buying exhaustion, virtually identical to the 2007 topping period.


Conclusions.   Bearish sentiment overall has reached extreme low levels where an INT top can occur at any time.  Whether it's the election or the virus or possibly something external that is the "reason" for a large decline is hard to tell.  I have been looking at two periods, 2015 for the INT term and 2008 for the LT as in the volume chart above.  It's interesting that Nov 30 was also a Mon in 2015 and a look at a chart might indicate one possibility, where we see a top the first week of Dec (vaccine news?), a decline into mid-month (electoral college vote?) and a couple of attempted rallies before a Jan-Feb plunge of 15%+/-.


Weekly Trade Alert.   There may be a continuation of the decline into next week that could drop below SPX 3500, but there may be another retest of the SPX 3620-70 area as early as the first week of Dec.  News of the approval of a vaccine by the FDA, possibly Nov 30 could provide a more important selling oppty.  Updates @mrktsignals.

Investment DiaryIndicator Primer,
 update 2020.02.07 Data Mining Indicators,
 update 2019.04.27 Stock Buybacks,
 update 2018.03.28 Dumb Money/Smart Money Indicators

Saturday, November 14, 2020

Another Top is Nearing

The previous week the SPX closed at 3509 and I was expecting a "pop&drop" to occur Mon/Tue targeting 3540-50 for a high and the Sun O/N ES was indicating an open in that range, but before the open Mon, Pfizer announced a positive vaccine trial with a "90% success rate".  This sent prices flying to SPX 3645 the 1st two hours, but a selloff began late aft that fell back to 3515 by Tue AM. This vaccine requires storage at -100 degrees C, so you have to wonder about the ease of dispersal. 

There was an interesting article in Project Syndicate recenly comparing the Trump/Biden POTUS election to that of the 1932 Hoover(GOP)/FDR(Dem).  Economic conditions were somewhat similar. and post-election Hoover also refused to accept defeat, claiming that FDR was "unfit" due to his bout with polio.  FDR ended up winning 4 consecuive elections, dying in offifce in 1945.

This week sentiment is shown back to Jan 2018.  The Tech/Other section takes a look at the current trend in Equity puts and calls that may be indicating a shift to extreme complacency similar to Sept-Nov 2018 as well as a Tech Indicator composite that is pointing to a near term top.  Sorry for last weeks editing, I didn't get a chance to proof read until Sun AM.


I. Sentiment Indicators

The overall Indicator Scoreboard (INT term, outlook two to four months) bearish sentiment has turned down and seems to be following a pattern similar to Jan-Feb 2020.


The INT view of the Short Term Indicator (VXX $ volume and Smart Beta P/C [ETF Puts/Equity Calls], outlook two to four months) bearish sentiment is also following the Jan-Feb 2020 pattern.


The VXX $ Vol is now testing the lows seen at the Aug and Oct 2020 tops.


Bonds (TNX).  Bearish sentiment in bonds remains vitrually unchanged in the strong SELL region.


For the INT outlook with LT still negative, the gold miners (HUI) bearish sentiment fell sharply, nearing the SELL region, questioning the durabiity of any bounce higher.


II. Dumb Money/Smart Money Indicators

The option-based Dumb Money/Smart Money Indicator as short/INT term (outlook 2 to 4 mns/weeks) bearish sentiment took a surprising turn upwards last week as the "smart" money appears to be turning more bearish similar to mid-Feb 2020.


And the sister options Hedge Ratio bearish sentiment is also similar to Jan-Feb 2020..


Last week I showed an indicator for the NDX/QQQ usig the 2x long ETF and equity calls which I called the NDX/QQQ term structure and this week will show the equivalent for the SPX using the 2x SSO ETF and the CPCRev calls (equity +ETF +SPX calls).  This is an INT term indicator and is also similar to Jan-Feb 2020 and has just started to turn down, so risk of a serious decline is a few weeks away.


For the equivalent hedge ratio previously I tried using the SPX puts and ETF calls for a hedge spread with mixed results but compared to the SSO hedge ratio was too bullish for mid-2018 and too bearish for mid-2020.


So comparable to the QQQ/NDX hedge ratio, I tried using the SSO ETF and ETF calls that is showing the same pattern of rising tops & bottoms as Jan-Feb 2020 and is now similar to early Feb.


III. Options Open Interest

Using Thur closing OI, remember that further out time frames are more likely to change over time, and that closing prices are more likely to be effected. Delta hedging may occur as reinforcement, negative when put support is broken or positive when call resistance is exceeded.  This week I will look out thru Nov 20. Also, this week includes a look at the GDX & TLT for Nov exp. 

With Fri close at SPX 3585, options OI for Mon is small and shows put suppor at 3530 with call resistance beginning at 3600.  There is a slight bearish bias between support and resistance but may be offset by general sentiment.


Wed has somewhat larger OI where SPX moderate call resistance above 3550 with put support starting at 3475.


For Fri, SPX has small OI currently, where SPX has an important inflection pt at 3500 where puts may support prices up 3575, but below 3500 the next level of put support is 3450 .


For the QQQ (NDX/41, 11.9k=290), closing at 290.9, this was a volatile week after a Mon high at 299 and a drop to 280 Tue to close just over put support on Fri.  Next call resistance is 295, but sentiment measures (term structure and hedge ratio) have dropped to neutral.


Using the GDX as a gold miner proxy closing at 38, strong put support is 37.5, while strong call resistance is 41.5.  There should be a slight positive bias next week.


Currently the TLT is 158.2 with the TNX at 0.89%, and after a drop to 154.5 when the TNX jumped to 0.95% early in the week, about 40% of the puts were exercised as smart money bailed before prices rose back to lower put support.. 


IV. Technical / Other

The equity puts and calls are no longer showing the speculatve excess seen in Jan, Feb, Aug & Oct 2020 as the anouncement of a c-virus vaccine has reduced the desirability of the FAMNGS tech stocks.  Rather than risk coming from excess speculation, we could be starting a trend last seen in Sept-Nov 2018, ie, excess complaceny show by a sharp drop in both puts and calls. .


This indicator (NYMO+TRIN+NYAD+NYUD) tends to overstate bearisness off of extreme selloffs due to breath thrusts but works well in mature markets.  We are now seeing a level of complacency similar to the Aug and Oct highs.


Conclusions.  Current sentiment is showing that a ST pullback of 3-5% is likely, but an INT top is not likely just yet.  The Mon/Tue volatility increased bearish sentiment significantly and may cause a retest/beat of the highs.  I expect a high next week to retest the SPX 3646 level +/-1%, 3620-70 with a selloff the last half of Nov (break of 3500 probable, 3450 possible), likely due to dissapointing holiday retail sales.  A possible final rally could carry into the Xmas period.  On the Money UK has a thorough discussion Nov 10, 11, & 13 with a somewhat more bearish outlook possibly down to low 3300s.

Weekly Trade Alert.  The rally may carry into options exp targeting the ATH +/-1% or 3620-70 followed by a pullback to 3450-3500 by the end of Nov.  Updates @mrktsignals.

Investment DiaryIndicator Primer,
 update 2020.02.07 Data Mining Indicators,
 update 2019.04.27 Stock Buybacks,
 update 2018.03.28 Dumb Money/Smart Money Indicators