Saturday, January 26, 2019

Trumpty Dumpty Sat on a Wall

Last week I raised the prospect that there may only be a partial retest of the SPX lows at 2350 and that the low 2700s were likely to be seen first, and now we have the prospect of another "hope" rally as more trade talks are scheduled for the end of Jan.  We did get a small pullback of about 2% as bearish sentiment indicated the possibility of an Apr 2018 type pullback and the NDX ETFs were giving a warning signal.

As posted on Twitter Wed, the Hedge Ratio (an options equivalent of a short interest ratio) moved back to the level of the previous Wed before the run over SPX 2600. I am not sure how many are still looking for a 2000-02 or 2008-09 bear market, but in the Technical / Other section this week, I will take a current look at the $SKEW and $NYUPV/$NYDNV that warned of the downturn in Oct (but not a LT bear market) as well as the Hedge Ratio update.


I. Sentiment Indicators

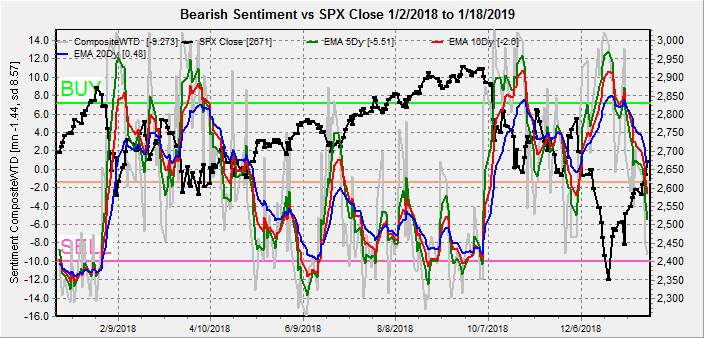
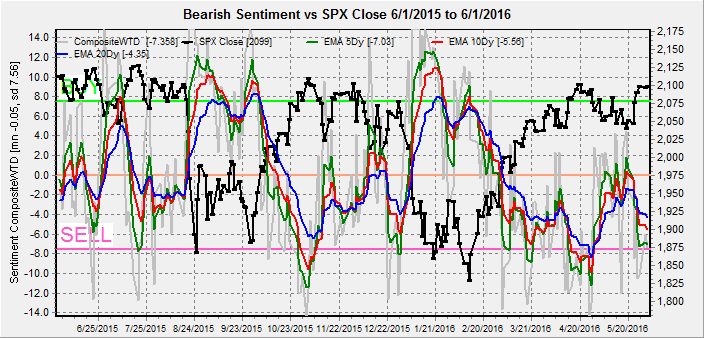
The overall Indicator Scoreboard (INT term, outlook two to four months) bearish sentiment remains in a similar pattern to the May-Jun pullback of 2018.


The INT view of the Short Term Indicator (VXX+VXXB $ volume and Smart Beta P/C, outlook two to four months) bearish sentiment also remains in a similar pattern to the May-Jun pullback of 2018.


Bond sentiment (TNX) is still looking like the Jun-Sep 2018 period where a three month consolidation was seen before a sharp runup in rates.


For the INT outlook with LT still negative, the gold miners (HUI) bearish sentiment has been rising, and if the US $ continues to fall based on dovish outlook from the Fed, a rally in HUI is possible similar to Jul-Sep 2018 before a larger decline.


II. Dumb Money/Smart Money Indicators

The Risk Aversion/Risk Preference Indicator (SPX 2x ETF sentiment/NDX ETF sentiment, outlook 2 to 4 mns/wks) as a INT indicator continues to show high Risk Preference that may mean a weaker advance.


The option-based Dumb Money/Smart Money Indicator as INT term (outlook 2 to 4 mns/weeks) saw a fairly sharp move up in the Mon/Tue pullback to the SPX low 2600s, but has now moved back to neutral.


The INT term SPX Long Term/Short Term ETFs (outlook two to four weeks) bearish sentiment has finally started to fall below neutral with dumb money (2x) buying while smart money (3x) remains neutral.  Continued decline would point to a pullback in weeks ahead.


Long term neutral, the INT term NDX Long Term/Short Term ETF Indicator (outlook two to four weeks) as the long cycle seems to follow prices, the short cycle has moved back down from a brief spike earlier in the week.


III. Options Open Interest

Using Thurs close, remember that further out time frames are more likely to change over time.  This week I will look out thru Feb 1.

With Fri close at SPX 2665, Mon.  Light open int overall.  Put support is likely to keep prices over SPX 2640, and over 2650, call hedging could push prices toward 2700.


Wed is similar with put support at SPX 2640 and over 2650, decling resistance to 2750.  Very light open int overall.


Thur, Jan 31, has large open int with SPX 2650 a major inflection point with support below at 2600 and 2625, and above minor resistance at 2675 and 2700 and major at 2725.  With China trade talks thru EOM, this shows a "hope" rally potential to 2725+.


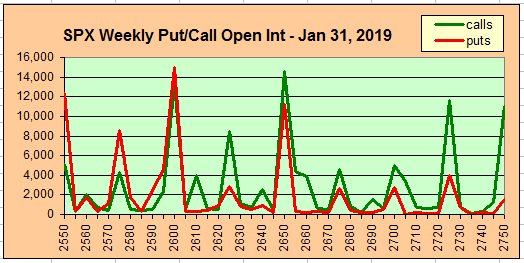
Fri, Feb 1 and jobs report, has large open int with SPX 2600 major support with call inflection pts at 2650 and 2700.  SPX 2675 seems the most likely close if prices fall below 2700.


IV. Technical / Other

The sharp drop in the $SKEW starting in Oct was a warning of extreme complacency, but over the last month has rallied sharply, very similar to the rally off of the Apr 2018 retest lows.  The big difference here is that the $SKEW levels remained high with last weeks pullback, indicating skepticism of the rally, unlike Apr-May 2018 and may limit ST losses.

The current $NYUPV/$NYDNV that also warned of a 10%+ pullback in Oct due to low $NYUPV then saw a huge move up the first two weeks of the rally from the Dec lows, but has since leveled off near the levels of 2015 Q1 and 2018 Q2 that makes me skeptical of some of the more bullish calls for SPX 3000+ in 2019.

The Hedge Ratio is now more closely tracking the options DM/SM indicator with a sharp spike early in the week supporting rally, and a close near neutral, but no indication of a pullback yet.


Conclusions.  I should of warned about a pullback to the SPX 50 SMA before a possible move to the 100 SMA at 2720, but last Sat I was in a hurry preparing for the Artic blast.  The next week could see the expected move over 2700, but there are few signs yet of any pullback.  The SPX ETF DM/SM indicator may provide early warning.  Now that Trump seems to have given up on the US/Mexico wall, the big question is whether he will do the same with trying to wall in China.  The more I read, the more I think that trade is only a small part of the concern with China as expressed in this article where China is a symptom of the US losing its world dominance.

March still looms as an important inflection in time.  If a trade agreement is reached with China that fixes the market and economy problems, would the Fed abort its current dovish outlook?  Investors anxiety is likely to be high in Feb.

Weekly Trade Alert.  There is a good chance of a tradeable top in SPX between 2720-40 in the next week or two. .Updates @mrktsignals.

Investment DiaryIndicator Primer,  update 2018.03.28  Dumb Money/Smart Money Indicators
Article Index 2018 by Topic
Article Index 2017 by Topic
Article Index 2016 by Topic
Long term forecasts

© 2019 SentimentSignals.blogspot.com

Saturday, January 19, 2019

Will There Be A Retest?

Last week I focused on the comparison to the 2015-16 market declines concluding that after a rally to SPX 2620-40, a higher retest of the lows could see the SPX rally to 2720-40 and eventually 2850.  Over the last week, several considerations have made me wonder if a "v-bottom" and rounded top as was seen off the Oct 2014 lows is possible.  First,China trade talks were not as fruitful as some expected (reinforcing the "nuclear option" down the road), but may have gotten a reprieve with late week rumors.  Second, options sentiment does not show an indication of a sharp decline or rally (ie, range bound).  Third, in the Technical / Other section, I will show a single indicator that performed the best for the 2015-16 retests that was still pointing upwards as of Wed.


I. Sentiment Indicators

The overall Indicator Scoreboard (INT term, outlook two to four months) bearish sentiment has declined sharply, now consistent with the Apr 2018 rebound top that was followed by a SPX 120 pt drop.


The INT view of the Short Term Indicator (VXX+VXXB $ volume and Smart Beta P/C, outlook two to four months) bearish sentiment has declined sharply, now also consistent with the Apr 2018 rebound top that was followed by a SPX 120 pt drop.


Bond sentiment (TNX) is still following the Jun-Sep 2018 period with an initial runup in rates similar to late Jun 2018, where a three month consolidation was followed by sharp runup in rates.


For the INT outlook with LT still negative, the gold miners (HUI) bearish sentiment rose sharply, but this time I expect LT sentiment to reach the 2015 levels before an inflation rally begins.


II. Dumb Money/Smart Money Indicators

The Risk Aversion/Risk Preference Indicator (SPX 2x ETF sentiment/NDX ETF sentiment, outlook 2 to 4 mns/wks) as a INT indicator has dropped sharply, warning that preference for NDX has reached the danger levels.


The option-based Dumb Money/Smart Money Indicator as INT term (outlook 2 to 4 mns/weeks) has finally moved below neutral but is well off the Apr 2018 lows, indicating another week or two of rally is likely.


The INT term SPX Long Term/Short Term ETFs (outlook two to four weeks) bearish sentiment has also moved down but is well off the Apr 2018 lows, indicating another week or two of rally is likely.


Long term neutral, the INT term NDX Long Term/Short Term ETF Indicator (outlook two to four weeks) as the long cycle seems to follow prices, the short cycle has reached the Apr 2018 top level.


III. Options Open Interest

Using Thurs close, remember that further out time frames are more likely to change over time.  This week I will look out thru Jan 31 and Feb optn exp.

With Fri close at SPX 2671, Tue (MLK holiday) could move up or down, with first call resistance at 2675 then 2700 and lower support around 2625.  Light open int overall.


Wed is similar with inflection pts at SPX 2625, 2650 and 2675.  Remember that above call levels dynamic hedging may support prices and over 2675 there is little resistance to 2750.


Fri, has many overlaps but with current sentiment and momentum a move towards SPX 2700 seems likely with stronger resistance at 2725.  Moderate open int.


For EOM, the overlaps again make interpretation difficult, but overall downward pressure is likely toward SPX 2650.  Possibly a setup similar to the EOM Jan 2018.


For Feb optn exp, this one has a definite downward bias, although the open int is small, with a move down to/below SPX 2580 likely.


IV. Technical / Other

Last week, I showed a comparison of the Technical Composite (NYMO,TRIN,NYAD,NYUD) that showed overbought extreme, but with bullish implications compared to 2015 and 2016 in a rally off retest lows.  This week I want to address the idea of a retest of the lows.

So I started working on this Wed, before the Thu-Fri romp over SPX 2675, but since everyone seemed to be looking for a retest of the Dec lows, I decided to look for the best indicator for the 2015-16 correction retests.  Only one indicator stood out and that was a variation of the options DM/SM Indicator I call the Hedge Ratio.  Both indicators are usually in sync and the DM/SM Indicator works better for short time frames, but this time they are out of sync with the Hedge Ratio still positive (Wed) while the former was stuck in neutral.  A sharply declining Hedge Ratio was seen before both the 2015 and 2016 retests, so that will probably be the first sign of trouble.

The indication now is that a direct move to test the SPX 100 SMA at 2720-40 is likely before a pullback.  Comparing this to the Apr 2018 rally off retest lows, the SPX rallied briefly thru the 100 SMA at 2700 before a 64% retracement of 120 pts and currently the 100 SMA is at 2732.  A similar pullback would be to about SPX 2500.  Note the 62% retracement of the Oct-Dec 2018 decline is SPX 2722.


For the 2015 retest, the sharp drop was about two weeks before the top and similar to today, while the 2016 retest occurred after the sharp drop.


Conclusions.  Sentiment overall is pointing to pullback soon.  From current levels a SPX pullback of 120 pts is consistent with sentiment, while a continued rally into the last week of Jan in the SPX 2720-40 area would likely see a 62% retrace where both would target the low SPX 2500s.  Options open int seems to point to continued strength with a drop off in Feb.

Weekly Trade Alert.  Next target for the SPX is probably the 62% retracement of the Oct-Dec decline or the 100 SMA 2720-40 before the EOM, but the risk exists for an immediate pullback to the low 2500s.  Options open int show the potential for a move to 2720-40 before EOM, with a decline starting by EOM thru Feb optn exp or longer.  Updates @mrktsignals.

Investment DiaryIndicator Primer,  update 2018.03.28  Dumb Money/Smart Money Indicators
Article Index 2018 by Topic (will update soon)
Article Index 2017 by Topic
Article Index 2016 by Topic
Long term forecasts

© 2019 SentimentSignals.blogspot.com

Saturday, January 12, 2019

Complex Bottoms

Continuing divergences between the dumb/smart money ETF indicators and most of the other indicators continues to puzzle me.  Unlike many other analysts that look at price analogs, I prefer to look at sentiment analogs.  Surprisingly there was a similar divergence between ETF and other indicators during the 2015-16 period.  There we saw the Aug 2015 flash crash with a higher retest a month later that was followed by a failed retest of the ATH, then an even larger decline several months later in early 2016.  The first decline showed the same divergences seen today that may be indicating bigger problems later this year after a significant rally (80% retrace from ATH).  More in individual sections.

Last week, I mentioned that the jobs number was likely skewed by seasonal adj and a couple days later Lee Adler posted that the actual jobs added was only 54k, while over 250k were added by comparison to the avg Dec numbers.

Over the next few weeks I'm expecting enough whipsaws to confuse everyone.  Currently most sentiment and talking heads seem to expect clear sailing up to new highs similar to the rally off the Apr 2018 lows, but what could go wrong?  China trade talks showed little progress, the Fed is confused, and heavy EPS reports start next week.  A test of the SPX 50 SMA at 2630s may be all she wrote before a b-wave of Oct-Dec correction retrace to fill the Jan 4 gap at 2445, if overall earnings don't disappoint another wave up in Feb is likely, but Mar will be tough when possible China tariffs redux and Fed FOMC may still cause a full retest of the Dec lows.

I. Sentiment Indicators

The overall Indicator Scoreboard (INT term, outlook two to four months) bearish sentiment is starting to drop and is following a similar pattern to Apr 2018.


A look at 2015-16 shows that current sentiment is at similar levels to the Sep 2015 and Feb 2016 retests.


The INT view of the Short Term Indicator (VXX+VXXB $ volume and Smart Beta P/C, outlook two to four months) bearish sentiment is also following a similar pattern to Apr 2018.


Bond sentiment (TNX) is still looking like the Jun-Sep 2018 period where a three month consolidation was seen before a sharp runup in rates.


For the INT outlook with LT still negative, the gold miners (HUI) bearish sentiment may have caused a top in the HUI as rates have bottomed out, but the dollar remains a wild card, where in Jul-Aug 2018 a sharp decline in the US $ caused a spike in prices.


II. Dumb Money/Smart Money Indicators

The Risk Aversion/Risk Preference Indicator (SPX 2x ETF sentiment/NDX ETF sentiment, outlook 2 to 4 mns/wks) as a INT indicator is showing risk preference as investors are chasing the high beta (NDX) stocks expecting a Apr-Oct 2018 run up - not bullish ST for NDX.


The option-based Dumb Money/Smart Money Indicator as INT term (outlook 2 to 4 mns/weeks) is oddly exactly at neutral, but similar to Apr 2018, as both dumb and smart P/C are increasing - more volatility, but limited downside.


Comparing to 2015-16, both were close to neutral before the retests with 2015 above and 2016 below.


The INT term SPX Long Term/Short Term ETFs (outlook two to four mns) bearish sentiment remains similar to Apr-May 2018 as both dumb and smart money are buying with smart in the lead.  A weak uptick last week indicates somewhat higher prices ahead before a pullback.


Comparing to 2015-16, the 2019 slightly positive sentiment is more like the Jan-Feb 2016 period before the retest, but the persistent low readings the last half of 2015 leads me to believe that it was just a B-wave of a large ABC correction from May 2015 to Feb 2016 (9 months).  Thus the low readings in 2019 may also indicate a B-wave correction is occurring, and if the entire ABC takes 9 months this would put the C-wave lows in the Fall (same as the 2010-11 analog).


Long term neutral, the INT term NDX Long Term/Short Term ETF Indicator (outlook two to four mns) as the long cycle seems to follow prices, the short cycle has turned down - negative ST.


III. Options Open Interest

Using Thurs close, remember that further out time frames are more likely to change over time.  This week I will look out thru Jan 18, opt exp.

First, a look at last Fri shows why the SPX was stuck between 2575 and 2600 with an upward bias.


With Fri close at SPX 2596, Mon as long as the SPX holds above 2570 there is little call resistance at higher levels.  Light open int overall.


Wed is unusual as it looks like Wrongway Gartman has a $60M bet that the SPX will close below 2630, dwarfing other positions.  Expect 2630 puts to pull SPX to 2630 or higher.


Fri, for optn exp including SPY with SPX PMs, holding 2625 could push SPX to 2675, but more likely close is 2605-15.


SPY also shows a likely close of 261 to 265.


IV. Technical / Other

This week I am going to take a look at the Technical Indicator Composite (NYMO + TRIN + NYAD + NYUD).  Several analysts have noted that extreme overbought readings have driven the TI indicators to near record highs, indicating that another sharp pullback is around the corner.  NorthmanTrader has gone as far as using the NYMO highs compared to the Jan 2009 rally off the Dec 2008 lows as an argument that another bear leg is about to begin.  The TI composite also shows extremes, but looking over the past several years, four instances are comparable, Oct 2015 off the Sep retest lows, Mar 2016 off the Feb retest lows, the late Nov 2018 highs and last week off the Dec 2018 lows (see charts below).  The first two occurred with high bearish sentiment and the rally continued, while for the third bearish sentiment was low and we had the Dec crash.  Now, we still have high bearish sentiment, and combining with the SPX ETF DM/SM sentiment similarity to 2015-16, a continued rally is more likely.

Chart for 2015-19.


Chart for 2015-16.  Closer examination also shows that the extreme overbought readings occurred at the 50% level of the rally.  Comparing this to today if SPX 2347 to 2597 or 250 pts is halfway then the rally should continue to 2850ish.


Chart for 2018-19.


Conclusions.  Lot of charts today, but I thought the comparison to the 2015-16 might clarify the overall picture.  So now what we have is Oct-Dec as an A of an INT ABC decline with a B-Wave in progress.  B-waves can be 80%+ retracements with new ATH possible.  The C-wave may be several months away, possibly late summer-early fall.  This explains the somewhat wimpy readings for the ETF DM/SM indicators since the same thing happened in 2015-16.  Currently, a decline down to SPX 2430-50 may be all the retest we see as Sep 2015 was a higher retest and the SPX ETF DM/SM Indicator is more positive now.  If this is a abc corrective rally and a=280 pts to 2630, then c=a implies the next rally will test the 200 SMA around 2720-40.  What happens after that depends on the China trade talks and the Fed.

Weekly Trade Alert.  Last weeks outlook for a move to SPX 2600 was close and next week may top out in the 2630s Wed/Thu with slightly lower prices expected by Fri.  Updates @mrktsignals.

Investment DiaryIndicator Primer,  update 2018.03.28  Dumb Money/Smart Money Indicators
Article Index 2018 by Topic
Article Index 2017 by Topic
Article Index 2016 by Topic
Long term forecasts

© 2019 SentimentSignals.blogspot.com

Saturday, January 5, 2019

Was AAPLs Guidance a Warning?

Jan 2018 rose 3% in the first week and 7.5% at the high for the month, but was then down 9% for the year at the Dec lows.  Jan 2019 is starting out as much more volatile first dropping 2% into Thur then rallying to up 1% for the year at the Fri close.  This year Jan may be a a better indicator as my overall outlook is continued volatility with an upward bias.

Fri rally was partly due to the monthly jobs report that showed a stronger than expected 312k jobs added with an increase of 3.2% annual wage increase, but the unemployment rate actually rose to 3.9%.  The unusually warm winter may have much to do with the strong jobs number, especially in construction, as seasonality compares the actual increase to an average.  The rise in unemployment may be more important to the Fed, discussed last week, for outlook to changes in fed funds policy and was forecasted Wed in the Twitter update using the St.Louis Fed Initial (Unemployment) Claims report.

The biggest reason for the rally was likely the more dovish stance by the Fed head Powell as he indicated that the "Powell put" may be in play if the markets continue to unravel.  This still supports the outlook for a Mar retest as the banksters are likely to play "put up or shut up" going into the Mar FOMC.

Looking forward, the weak pullback in SPX (38% vs 62%) to 2450 may be more immediately bullish, but could point to a rally that lasts only into mid Jan before a retest of the lows by the end of EPS season late Feb if more stocks follow the lead of AAPL.  This timing is also closer to the Jun-Sep 2017 time frame indicated by action in bonds and gold stocks shown below.

I. Sentiment Indicators

The overall Indicator Scoreboard (INT term, outlook two to four months) bearish sentiment continues near the BUY area similar to the Mar-Apr retest.


The INT view of the Short Term Indicator (VXX+VXXB $ volume and Smart Beta P/C, outlook two to four months) bearish sentiment has dropped from the extreme BUY area, but still higher than in the Mar-Apr retest and may be contributing to the stronger uptrend than expected.


Bond sentiment (TNX) has dropped to the strong SELL area that could be sitting up for a Jun-Sep 2017 type bottom, hinting that once current problems such as govt shutdown and China trade are resolved, a strong rise in rates may follow.


For the INT outlook with LT still negative, the gold miners (HUI) bearish sentiment has seemed to follow a close relationship with bonds while miners prices followed an inverse relationship with rates as the last high in Sep 2017 was the low for TNX rates.  If rates do eventually rise strongly, a second bear leg down may follow for the miners.


II. Dumb Money/Smart Money Indicators

The Risk Aversion/Risk Preference Indicator (SPX 2x ETF sentiment/NDX ETF sentiment, outlook 2 to 4 mns/wks) as an INT indicator remains near neutral as the NDX is not expected to outperform as in early 2018 or under perform as in late 2018.


The option-based Dumb Money/Smart Money Indicator as INT term (outlook 2 to 4 mns/weeks) has fallen to neutral about the same level as the early Apr retest period.


The INT term SPX Long Term/Short Term ETFs (outlook two to four mns) bearish sentiment remains near neutral after being on a SELL for much of the second half of 2018 as the smart money (3x ETFs) has shown no interest in buying the current rally.


Smart money not buying it.


Long term neutral, the INT term NDX Long Term/Short Term ETF Indicator (outlook two to four mns) as the long cycle seems to follow prices, the short cycle is not showing any directionality.


III. Options Open Interest

Using Thurs close, remember that further out time frames are more likely to change over time.  This week I will look out thru Jan 18, optn exp.

With Fri close at SPX 2532, Mon shows some put support at SPX 2500, but not much else until 2425 and call resistance at 2525 and then 2575.  Light open int overall, but easy to see some volatility either way.


Wed is shows strong put support at SPX 2450 and below, 2500 could be a magnet with large puts and calls while there is little (net) resistance above 2525.


Fri, with large open int, looks more bearish with large call resistance at SPX 2510 and 2525 and moderate at 2550.  Large put support at 2440 and 2450.  A move below 2500 early in the week is likely to stay there, while above 2525 the calls can provide support.


Fri, optn exp, SPX (PM) looks bi-modal, where a move over SPX 2575 is likely to push up to 2600-25 and a move below 2525 should stop at 2500.


Looking at SPY, there is a positive bias due to large puts up to SPY 260 for a 260-92.5 target, but the large call position at 250 is also an inflection pt.


IV. Technical / Other

The $NYUPV/$NYDNV continues to follow a bullish configuration, having already reached the levels of the Mar-Apr retest, may possibly follow the more bullish Aug 2015 pattern.


Currently, the 4 hr SPX appears to be in a LD or ED diagonal while below 2540, and with 2480 as ST support.  A break above SPX 2540 is likely to reach 2600-50 by mid Jan, optn exp.


Conclusions.  Overall options open int show what you would expect in an event driven market, where positive China trade news etc could drive the SPX to 2600-25 by optn exp, but no news is likely to keep prices around 2500.  Normal sentiment measures remain positive, but the SPX ETF indicator is still showing weak buying by the smart money.  The APPL warning Wed nite could be a precursor of other companies earnings guidance.  If so, the rally may sputter mid Jan (SPX 2600-25) and fade thru earnings season with a retest low late Feb.  Bonds (TNX) and the gold miners are showing similar sentiment to mid-2017 that provided a major low for int rates and a major high for gold stocks.

Weekly Trade Alert.  A break above SPX 2540 is likely the start of a move to 2600-25, while a break below 2480 could lead to the low 2400s.  Updates @mrktsignals.

Investment DiaryIndicator Primer,  update 2018.03.28  Dumb Money/Smart Money Indicators
Article Index 2018 by Topic
Article Index 2017 by Topic
Article Index 2016 by Topic
Long term forecasts

© 2018 SentimentSignals.blogspot.com