
As mentioned last week as the market rallied all week based on false hope and fake news tweets from our fearless (feckless) leader that a China trade detente (truce) was on the way, the end result was a stalemate or impasse that retraced all of the previous weeks gains and more. Can some lawyer out there start a class action lawsuit with the SEC to reimburse all traders that have been whipsawed as a result of these fake news Trump tweets? Musk after all was sued for $20 million.
Sentiment-wise bearish levels have risen slightly but remain well short of a BUY. One possibility is a trading range between SPX 2600 and 2700 similar to the month long range of 2575 to 2675 from mid-Mar to mid-Apr, but lower levels testing the Feb lows at 2532 (2500-50) are ideal to set up positive divergences with the daily RSI and MACD. As mentioned on Twitter the up/down cycles compared to midterm 2010 seem to be 8/9 days, so a trading low may be seen Dec 17/18 before the FOMC Dec 18/19.
I. Sentiment Indicators
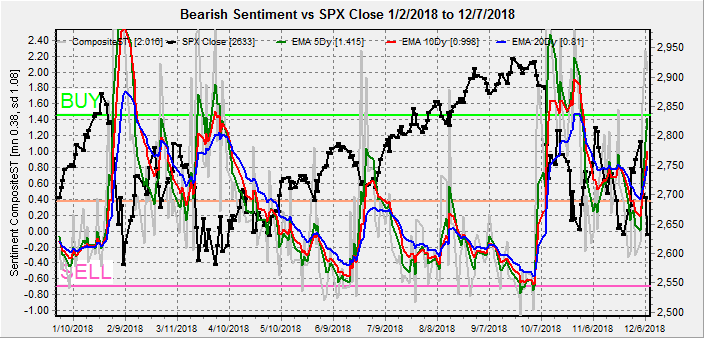
The overall Indicator Scoreboard (INT term, outlook two to four months) sentiment has moved well above neutral, but only at the level near SPX 2700 in the Mar retracement. I am beginning to wonder if sentiment will reach the Apr levels, however, since this is more consistent with a partial retrace (possible 2550 lows, 2875 retrace)

The INT view of the Short Term Indicator (VXX $ volume and Smart Beta P/C, outlook two to four months) shows somewhat higher ST bearish sentiment that may point to a pause for a couple days.
Bond sentiment (TNX) has now moved to a mildly negative outlook that may mean a consolidation at current levels similar to July. A continued decline in sentiment will likely lead to higher rates.

For the INT outlook with LT still negative, the gold miners (HUI) saw a price breakout from the recent 140-50 range with the combined support of lower rates and a weak dollar even with weak bearish sentiment, but rates appear to be pausing so the price rise could be temporary.

II. Dumb Money/Smart Money Indicators
The Risk Aversion/Risk Preference Indicator (SPX 2x ETF sentiment/NDX ETF sentiment, outlook 2 to 4 days/wks) as an INT indicator has now risen back to neutral. As pointed out early on the result of low sentiment would likely be under performance by the NDX compared to SPX and since Oct the NDX is down by almost 50% more.

The option-based Dumb Money/Smart Money Indicator as short/INT term (outlook 2 to 4 days/weeks) remains at very low levels indicating that downward price volatility is likely to remain high.

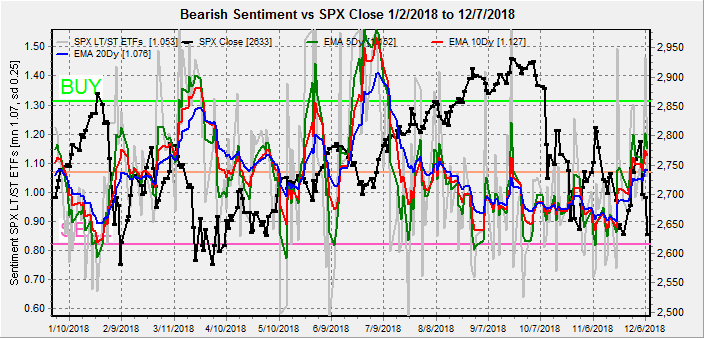
The INT term SPX Long Term/Short Term ETFs (outlook two to four weeks) bearish sentiment has now moved to neutral but remains well below the levels seen in the Mar-Apr retest. Expect significantly lower prices now or later as the dumb money (2x ETFs) was largely unfazed by the current correction.
Long term neutral, the INT term NDX Long Term/Short Term ETF Indicator (outlook two to four weeks) remains in a range similar to Apr-Jun that may indicate a bottoming..

III. Options Open Interest
Using Thurs close, remember that further out time frames are more likely to change over time. This week I will look out thru Dec 14.
With Fri close at SPX 2633, Mon has very light resistance up to 2650 if the market rallies, over 2650, 2670 seems posible. Good support at 2600. Light open int overall.

Wed open int is very light, but below SPX 2680, prices could drop to 2625. A strong market could push to 2700.

Fri shows larger open int but puts dominate and could lead to higher volatility. Below the large positions at SPX 2600, 2630 and 2680 may cause put writers to sell futures so these are likely to be inflection pts when crossed from above. Lack of calls makes direction difficult to access, but above or below 2650 should go to next inflection pt..

IV. Technical / Other
Assuming the markets are a near a tradeable bottom, this is approximately what I expect based on the 2010-11 analog. In this case, weaker sentiment than seen in Apr leads to a lower top mid-late 2019, making a H&S top with Jan and Oct of 2018. What happens next is anybody's guess, but one political analyst discusses Trumps options if the China trade war drags on and concludes that a re-escalation is likely. This could lead to an SPX 500 pt waterfall.

A prominent EW analyst also shows a similar projection for both time and price here.
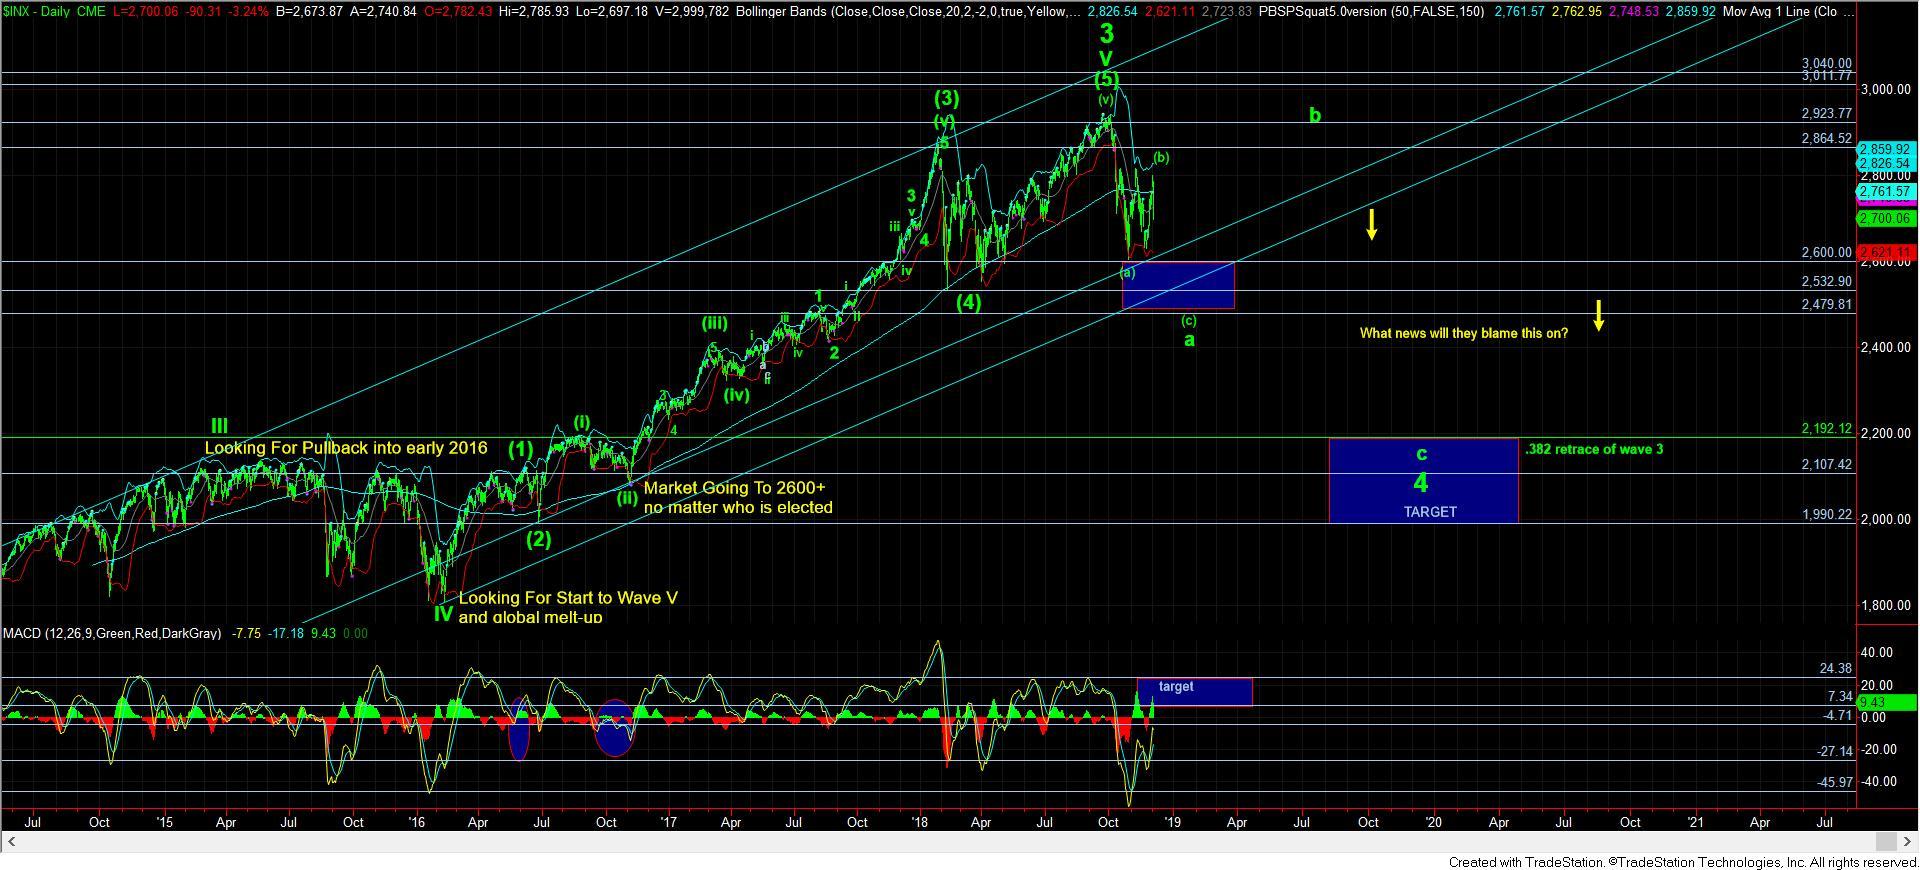
Conclusions. Last weeks option open int proved accurate as SPX 2750 was seen as a major inflection pt with above pointing to 2800 and below to 2700 or lower. Sentiment is moving in the right direction for a bottom in a week to 10 days, and seems likely that the banksters will do everything they can to encourage the Fed to stop taking away the cookie jar, so a sharp decline from Fri/Mon/Tue below 2600 is the best way to achieve this.
Weekly Trade Alert. The ST Indicator pts to a possible pause for a couple of days and one EW blogger sees this as a small triangle that breaks down at the EOW. Ideally my targets for the bottom are Dec 17/18 at SPX 2500-50 setting up a positive divergence before the FOMC. A strong EOY rally could follow. Updates @mrktsignals.
Investment Diary, Indicator Primer, update 2018.03.28 Dumb Money/Smart Money Indicators
Article Index 2018 by Topic
Article Index 2017 by Topic
Article Index 2016 by Topic
Long term forecasts
© 2018 SentimentSignals.blogspot.com
No comments:
Post a Comment