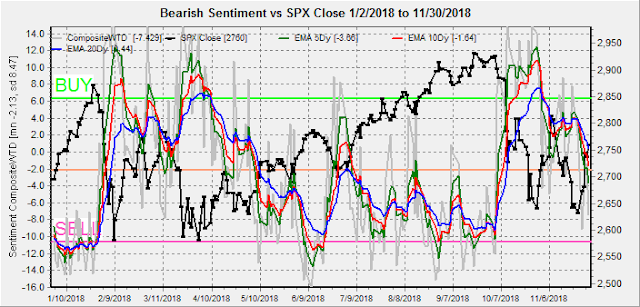
Most sentiment measures remain near neutral INT term. This could mean a near-term rally, but are also at the same point as in Mar 2018 before the Apr 200 pt SPX decline.
I. Sentiment Indicators
The overall Indicator Scoreboard (INT term, outlook two to four months) continud its drop to neutral, but at similar levels to the mid-Mar decline.
The INT view of the Short Term Indicator (VXX $ volume and Smart Beta P/C, outlook two to four months) continues to mimic the overall Indicators move to neutral and the mid-Mar levels.
Bond sentiment (TNX) remains mildly positive, hovering above neutral.
For the INT outlook with LT still negative, the gold miners (HUI) bearish sentiment fell fairly sharply last week, possibly due to the less hawkish Fed outlook.
II. Dumb Money/Smart Money Indicators
The Risk Aversion/Risk Preference Indicator (SPX 2x ETF sentiment/NDX ETF sentiment, outlook 2 to 4 days/weeks) as an INT indicator remains in negative territory as low risk aversion shows continued complacency.
The option-based Dumb Money/Smart Money Indicator as short/INT term (outlook 2 to 4 days/weeks) has dropped to a SELL, but the effectiveness depends upon overall sentiment (neutral). In Dec 2017 (a strong market) on two occasions with similar sentiment, there were one day pullbacks of SPX 30 pts within the uptrend..
The INT term SPX Long Term/Short Term ETFs (outlook two to four weeks) bearish sentiment has risen to neutral similar to early Mar, before the Apr retest. Both smart and dumb (3x/2x) ETF sentiment has moved to neutral.
Long term neutral, the INT term NDX Long Term/Short Term ETF Indicator (outlook two to four weeks) remains at a low level.
III. Options Open Interest
Using Thurs close, remember that further out time frames are more likely to change over time. This week I will look out thru Dec 7.
With Fri close at SPX 2760, Mon SPX could see a positive effect from the 2750 calls up to the 2770 level, but a move below 2750 should push down to 2715 then possibly 2700 put support. Light open int overall.
Wed is somewhat similar, where over SPX 2725 and 2750 could push up to 2800, but below those levels could fall to 2675. The key factor obviously the China trade outcome
For the following Fri, a jobs report day with large open int, where SPX 2750 is key, with strong call resistance starting at 2775 and strong put support at 2675.
IV. Technical / Other
I've seen a couple of analyst point to the high equity p/c and low Skew as bullish, so I just wanted to show some historical perspective. Note, the Equity P/C is part of the options DM/SM Indicator as smart money.
For 2018, note the steady uptrend of the Equity P/C, even before the selloff.
Comparing this to 2015, you see the same upward trend starting in May where the recent high of 0.80 was reached in July, a month before the Aug flash crash.
For the $SKEW, previously I have pointed out that results were dependent on other sentiment, but the recent drop has been historic and is looking more like extreme complacency. We are also at late 2007 levels, nearing the levels seen in 2008 where a combination of falling prices and falling $SKEW led to tragic results.
Conclusions. As pointed out last week, news is likely to be the key driving force as the dovish outlook from Powell pushed the SPX to the first target of 2750. I have very little success at predicting Trump's decision, but the options open int is predicting some type of pullback later in the week if SPX falls below 2750.
Weekly Trade Alert. The surprise for the week may be an impasse to the China trade talks that leads into a triangle pattern similar to Jul-Aug 2015, if Trump then imposes the 25% tariffs on China in Jan a repeat of Aug 2015 may follow. Updates @mrktsignals.
Investment Diary, Indicator Primer, update 2018.03.28 Dumb Money/Smart Money Indicators
Article Index 2018 by Topic
Article Index 2017 by Topic
Article Index 2016 by Topic
Long term forecasts
© 2018 SentimentSignals.blogspot.com


No comments:
Post a Comment