This must have the bears scratching their heads, as the inverted yield curve and signs of a slowing economy are usually enough to begin a bear market in stocks. However, as pointed out before, the seemingly inane actions of POTUS always seem to support his laissez faire approach to corporate governance, and as a result, the stock market. What does this mean going forward?
In the Tech/Other section, I will discuss several items that indicate the topping may extend into mid-2020 with bearish implications that are likely to surprise many.
I. Sentiment Indicators
The overall Indicator Scoreboard (INT term, outlook two to four months) bearish sentiment is not extreme, but has matched that of the May correction.

The INT view of the Short Term Indicator (VXX+VXXB $ volume and Smart Beta P/C [ETF Puts/Equity Calls], outlook two to four months) bearish sentiment has also matched that of the May correction.

Bonds (TNX, sentiment TBT/TLT). Interest rates continue to hover around the 1.5% level with little change in sentiment.

For the INT outlook with LT still negative, the gold miners (HUI) bearish sentiment continues at low extremes, but seems to be having little effect on prices.

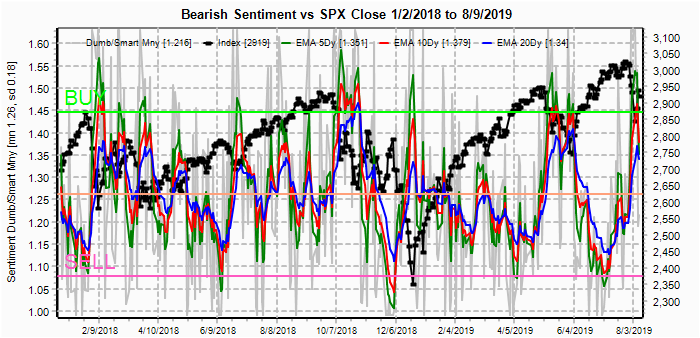
II. Dumb Money/Smart Money Indicators
For this week and possibly for the next several months, I am going to replace the DM/SM ETF indicators with other indicators.
The option-based Dumb Money/Smart Money Indicator as short/INT term (outlook 2 to 4 mns/weeks) LT EMAs have now exceeded that of May, although still below Oct 2018. This may be why pullbacks have become so short-lived as the Sun O/N retest of the SPX futures lows were reversed by the cash open. If continued, a sharp rally is likely at some point.

And the sister options Hedge Ratio sentiment is still lagging. I went back to study historical data back to Aug 2010 and overall the results have been 60% bearish/40% bullish so not a major problem yet, but continued low hedging may result in the more bearish outcome discussed in Tech/Other.

The INT term SPX LT/ST (2x/DM to 3x/SM) ETFs (outlook two to four weeks) bearish sentiment is starting to make more sense. Although way too bearish early 2019, this may have been due to correct "fundamental analysis" indicating a deteriorating economy, but incorrect forecast of market reaction. In any case, the outlook has become more favorable the last half of 2019.

The INT term NDX Long Term (2x/DM) ETFs (outlook two to four weeks) bearish sentiment continues to be weak and is likely contributing to NDX under performance.

Also, as mentioned in the intro, the lagging small cap RUT has been a warning sign for some, but one explanation is the lack of buyback support. Another reason as seen below is that bearish sentiment (3x TZA/TNA) remains neutral even though prices have been weak.

III. Options Open Interest
Using Wed close, remember that further out time frames are more likely to change over time, and that closing prices are more likely to be effected. This week I will look out thru Sept 6. Also, This week includes a look at the TLT for Sept 20.
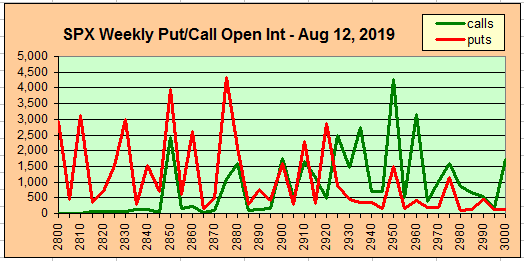
With Fri close at SPX 2926. The SPX followed the outlines posted in the Tu/Th updates showing support at SPX at 2870 early in the week and resistance at 2925 later in the week. Tue shows small OI that may hold the market between put support at 2900 and call resistance at 2925.

Wed with small OI shows SPX 2915 as pivotal in the 2900-2940 range where put support is at 2900 and minor call resistance at 2915, but puts at 2925 may draw prices higher if 2915 is exceeded. Next resistance is 2940

For Fri with large OI, the employment report is released, and the initial claims (1 yr) has been improving so a strong number is expected that may question further Fed easing. Calls at SPX 2900 and 2875 offset most of the put support, so a strong number is likely to see stocks reeling below 2900 with strong support at 2850.

Currently the TLT is 147.3 with the TNX at 1.51%. For Sept 20, options OI has not been that effective for int rates or gold miners lately, but the high call OI at 144 should pressure prices down to that level.

IV. Technical / Other
This week I want to consider the longer term outlook. The 2015 analog mentioned several times this year continues to seem likely as no breakdown below SPX 2800 has been seen. Using the 2X timeline with the current correction comparable to Jan 2015 implies a top around May 2020.
Another interesting pattern can be seen looking at the LT volume analysis of NYUPV /NYDNV, the chart below compares the current period to 2006-07 where a LT basing pattern of the 100 SMA around 1.50 was followed by a move up to 2.0, then a quick retest of the 1.50 level. The current bounce off the 1.50 level is comparable to Jan 2007, or 8 mns before the Oct top, also implying a possible mid-2020 current top. The 200 SMA followed a gradually ascending route. If the volume analysis is meaningful, this means more than a simple retest of the Dec lows is in store.

While most are looking at a lower retest around the SPX 2200 level as the upper range of the 2015 support area.
 The volume analysis suggests something more like what was seen in the 2011 retest of the 2010 trading range, and implies a potential 40% decline from an SPX 2020 top, possibly 3100-50 down to the 1900s.
Conclusions. So far, at least, the SPX analog to 2015 continues to hold. The big test may be in Oct as Brexit looks like it will happen then. The Sept trade talks with China could also spur a year-end rally if successful. Longer term, a successful Brexit that helps Britain (probably due to currency devaluation) could threaten the LT EU viability as both Spain and Italy may want to follow suit in 2020.
Weekly Trade Alert. SPX options OI is showing potential for a trading range of 2900-25 thru Wed, but a late week selloff to 2875-2900. Updates @mrktsignals.
Investment Diary, Indicator Primer, update 2019.04.27 Stock Buybacks, update 2018.03.28 Dumb Money/Smart Money Indicators
Article Index 2019 by Topic
Article Index 2018 by Topic
Article Index 2017 by Topic
Article Index 2016 by Topic
Long term forecasts
© 2019 SentimentSignals.blogspot.com