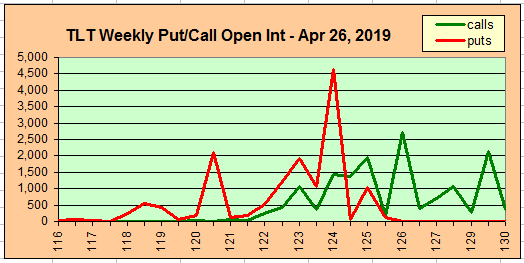
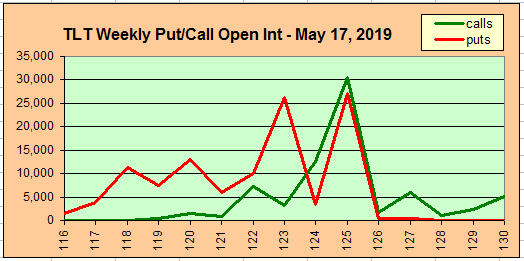
SPX options OI underestimated the markets strength as prices were able to power thru upper call resistance. TLT weekly options OI continued to do an excellent job forecasting TLT with a pullback early in the week to 122+ after a SELL on TBT/TLT ETFs, then a rally toward the expt close at 124 (act close 123.8). Next week projects to 123.
Big miss for me on GDP as I was expecting weaker numbers 1.5% expt, 3.2% actual, based on the outlook for strength in bonds (TLT). The inflation component was weaker than expected, so that pulled int rates down and gold miners up. Tariff Man may be getting more cocky supported by the recent "no problema" Mueller report and now the stronger GDP that may indicate the trade war is actually strengthening the US economy. The attitude shown by his recent call to Saudi Arabia to demand lower oil prices may also indicate the potential for a more hard line approach on China trade.
I. Sentiment Indicators
The overall Indicator Scoreboard (INT term, outlook two to four months) bearish sentiment continues to trend around the SELL level similar to Dec 2017.

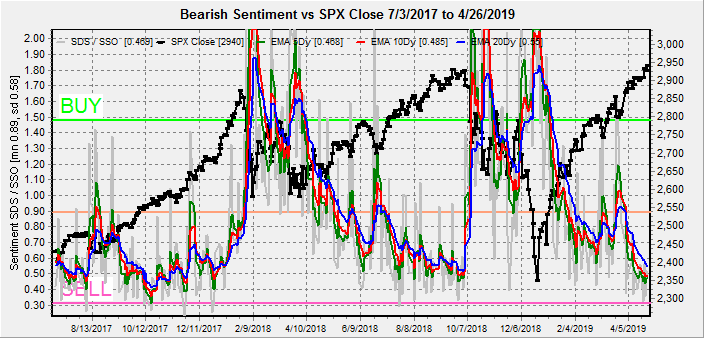
The INT view of the Short Term Indicator (VXX+VXXB $ volume and Smart Beta P/C, outlook two to four months) bearish sentiment has reached the lowest levels of the last two years, but the SPX topping process for Jan and Oct 2018 took place over a 3-4 month period sentiment-wise. My best guess is a mid-2015 type rounded top at SPX 3000+ that extends into Jul-Aug.

Bonds (TNX). Interest rates retraced part of their gains for Apr based on the weak inflation outlook in the GDP report, but I expect a continued rise in rates starting Jun-July.

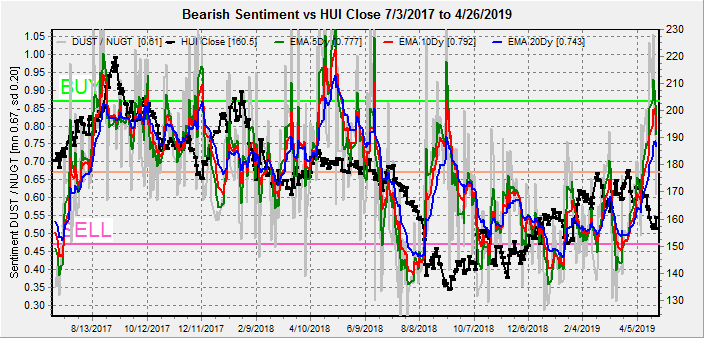
For the INT outlook with LT still negative, the gold miners (HUI) bearish sentiment briefly rose to a ST BUY, but prices continue to move inversely to int rates, so more downside action is likely starting Jun-July.
II. Dumb Money/Smart Money Indicators
For this week and possibly for the next several months, I am going to replace the DM/SM ETF indicators with other indicators.
The option-based Dumb Money/Smart Money Indicator as short/INT term (outlook 2 to 4 mns/weeks) remains low similar to the June 2018 top. The slight increase last week was from the dumb money component becoming more bearish, while the smart money is moderately bullish.

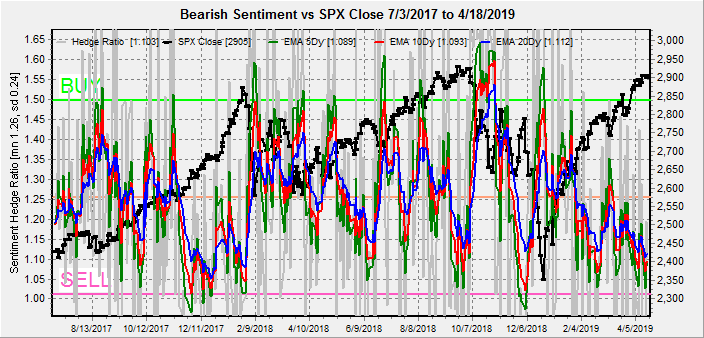
And the sister options Hedge Ratio sentiment is very low, but similar to the late 2017 period before the Jan blow off.

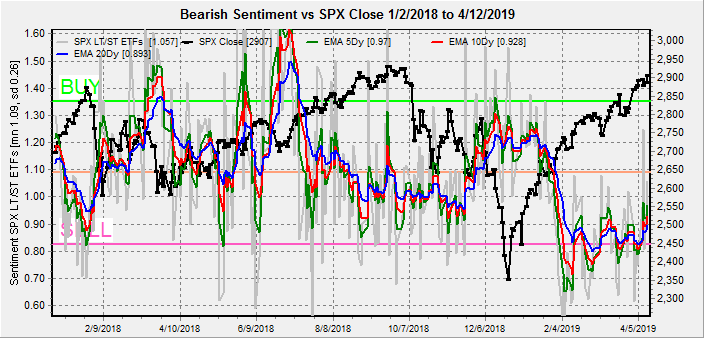
The INT term SPX Long Term (2x/DM) ETFs (outlook two to four weeks) bearish sentiment has not reached the extremes of the last two INT tops and supports several months more of upside.
The INT term NDX Long Term (2x/DM) ETFs (outlook two to four weeks) bearish sentiment is near the levels of mid 2018. More important may be be the almost perfectly symmetrical megaphone top that seems to be forming from the Jan 2018 highs. The NDX has been the clear leader since, up more than 10% from Jan 2018 and likely to advance another 6-8% to reach the megaphone top at 8300-400.

III. Options Open Interest
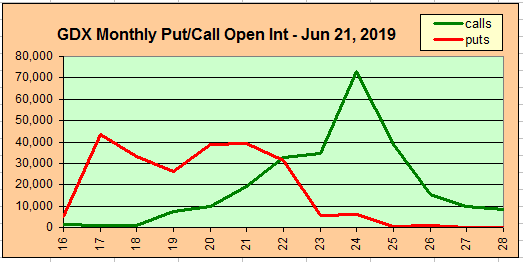
Using Wed close, remember that further out time frames are more likely to change over time, and that closing prices are more likely to be effected. This week I will look out thru Apr 30. Also, This week includes a look at the GDX thru Jun.
With Fri close at SPX 2940, put support is far below at 2900 and 2910, and may stay above calls at 2930 due to hedging and next resistance is 2950.

Tue EOM is much the same as Mon. If SPX remains over 2925, it could move to 2975.

Wed may see some retracement if SPX remains below 2950 with support at 2910, while a move over 2950 shows little call resistance.

Fri shows the most likely signs of a pullback, assuming more put support is not added during the week, where large call resistance between 2925 and 2965 could push prices down to the 2900-20 range.

Using the GDX as a gold miner proxy. For May exp, the large call positions at 24-5 somewhat distort the strong put support at 21, and the likely close is 21.5.

For Jun, the outlook is for slightly higher prices to 22.
IV. Technical / Other
Due to length, the stock buyback comments have been moved to the Investment Diary as
Stock Buybacks, Why are they used and how do they effect stock prices?
It's probably time to review the Sornett Bubble. The SPX has advanced 50% since the graph was constructed (2014) and I first showed it as a possibility in June 2017 and late Oct 2017. As it turned out, both the Jan 2018 blowoff and what followed fit the chart almost perfectly.
The current rally since Dec 2018 has been even steeper, but the pattern of smaller and smaller pullbacks until the market goes vertical seems to be playing out in 2019.

Conclusions. Overall, there no signs of any significant reversals in the SPX or other assets. The Sornett bubble properties indicate the possibility of a blow off in May, possibly due to a trade deal with China. The NDX megaphone potential for an additional 6-8% of upside may be the best guide price wise. My instincts tell me that this may be more of a rounded top as May 2015 and not a crash as was seen in Feb 2018. There seems to be progression in time and price of the recent INT corrections. Time wise, the Jan-Feb 2018 correction was 3 wks and Oct-Dec 2018 was 12 wks or 3 months, so the next C-wave may take 48 wks or 12 mns into mid 2020. Price wise, the first correction was 10%, the second 20%, so will the next be 30%?
Weekly Trade Alert. SPX options OI seem to indicate early week strength into EOM with the possibility for a late week pullback, depending on bearish put positioning. Updates @mrktsignals.
Investment Diary, Indicator Primer, update 2019.04.27 Stock Buybacks, update 2018.03.28 Dumb Money/Smart Money Indicators
Article Index 2019 by Topic
Article Index 2018 by Topic
Article Index 2017 by Topic
Article Index 2016 by Topic
Long term forecasts
© 2019 SentimentSignals.blogspot.com