
Bonds (TLT) fell 1% for the week, pushing below put support - a sign of weakness. Most of the decline was Fri where we saw an uptick in inflation both in imports, likely due to a delayed effect of tariffs after the late 2018 inventory build wore off, and exports, possibly due to agriculture.
There was a sharp pickup in VIX put buying last week and the VIX Put Indicator (Tech/Other) should reach a SELL early next week.
Overall, sentiment indicators for the SPX are looking very much like June 2018 before a 100 pt decline to 2700 before a late summer rally to 2940 in Oct. A similar SPX rally from a 2800 low could put a summer high at 3040.
I. Sentiment Indicators
The overall Indicator Scoreboard (INT term, outlook two to four months) bearish sentiment remains at the SELL level similar to Jun 2018.

The INT view of the Short Term Indicator (VXX+VXXB $ volume and Smart Beta P/C, outlook two to four months) bearish sentiment has remained lower for a longer period of time than at the 2018 Sep-Oct highs. Looking back for two years, this may be a predecessor to a volatility event similar to Aug 2017 and may be similar to the fractal discussed in Tech/Other.

Bond sentiment (TNX) is still looking like the Jun-Sep 2018 period where a three month consolidation was seen before a sharp runup in rates. We have already seen indications of higher inflation, if the GDP slump in Q1 was due to inventory runoff, Q2 may show a surprising bounce.

For the INT outlook with LT still negative, the gold miners (HUI) bearish sentiment remains low.

- For the ST, the bounce last week was weak and stronger sentiment may be required for a rally.

II. Dumb Money/Smart Money Indicators
The Risk Aversion/Risk Preference Indicator (SPX 2x ETF sentiment/NDX ETF sentiment, outlook 2 to 4 mns/wks) as a INT indicator does not show much guidance as preference for risky NDX remains high.

The option-based Dumb Money/Smart Money Indicator as short/INT term (outlook 2 to 4 mns/weeks) bounced slightly off its recent lows but remains similar to Jun 2018.

- And for the sister Hedge Ratio much the same.

The INT term SPX Long Term/Short Term ETFs (outlook two to four weeks) bearish sentiment bounced also but remains near a SELL.
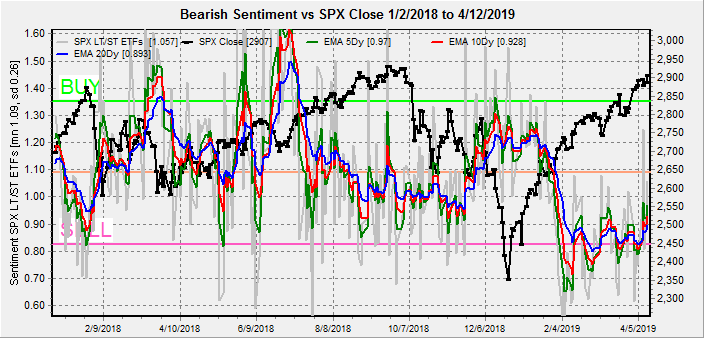
- The recent uptick in bearishness is due to the "smart money" (3x ETFs) being in drag for 2019 and now pulling a "wrong-way Gartman" after being strong sellers at the last ST bottom, now being strong buyers at what appears to be a top.

Long term neutral, the INT term NDX Long Term/Short Term ETF Indicator (outlook two to four weeks) has performed worst than the SPX ETFs for 2019, so this week I want to look at the individual 2x and 3x ETF indicators. The 2x ETFs are showing the lowest level of bearishness since Jun 2018.

- While for the NDX 3x ETFs, sentiment mirrors the SPX 3x ETFs, where strong buying has generated a weak SELL.

III. Options Open Interest
Using Thurs close, remember that further out time frames are more likely to change over time, , and that closing prices are more likely to be effected. This week I will look out thru Apr 30. Also, this week is GDX week.
With Fri close at SPX 2907, Mon shows no put support above 2900, while call resistance is light. Light open int overall.

Wed looks more likely to show a reversal below SPX 2900 with modest call resistance at 2910 and 2925, while hedging could push prices down to 2865-90.

Fri, optn exp, this week uses SPX AM that are mostly hedged and SPY PM. Large SPX call positions could push prices down to the 2850 level before put support appears.

- And SPY, Fri close 290, shows similar call resistance should prices down toward the 285 level.

For Apr 30 (EOM), below SPX 2875 there is little put support until 2800 and call resistance all the way down to 2825 that should push prices lower. SPX 2800-25 looks likely by EOM.

Using the GDX, Fri close 22.21, as a gold miner proxy. For Apr exp strong call resistance at 23 should cap the highs, while 22 is the most likely close.

- While for May exp, options OI is extremely large, and calls at 24 and 25 should cap prices and the likely close is 21. The most unusual aspect of the OI is the lack of put support. GDX options traders are betting on a one-way trade, possibly due to inflation expectations, but have created a sentiment backdrop similar to the SPX last Nov-Dec when everyone assumed seasonality would save the markets.

IV. Technical / Other
Late last week finally saw the volatility compression predicted by the low volume of VIX puts and has raised the VIX Put Indicator to a near ST SELL (44%) similar to Jun 2018 amd Feb 2019. VIX Calls also rose (20%) where 50% of the mean rise is an official SELL.

Another indicator, the "Safety Trade" Indicator of SPX/TNX sentiment is finally starting to fall as increased relative bearishness in bonds (indicating bondholders moving to stocks) has finally started to fall but appears to be several months from a INT SELL.

Finally, last week I was tracking a fractal from the Feb highs measuring the SPX rise relative to the 4 hr MAs (23,46,69) that measures to a high at 2915 the next 1-2 days. Whether the reaction is the same is uncertain, but it does fit the current options OI outlook.

Conclusions. It's interesting that the Brexit decision has been put off to Oct, a possible flash point for another rhyme with 1987. Another worrisome sign is that on a beary bearish forum I belong to, there has recently been a lot of talk about how great the economy is and that the DJIA is nearing a breakout to 30k. This reminds me of the summer of 2008 after the DJIA recovered most of the losses from the Lehman crisis and everyone was predicting 20k by the EOY.
For now, next week looks like it will be a top in the SPX with an expected drop to about 2800 by mid May. Depending on the sentiment outlook, a comparable bearish sentiment level to July 2018 may produce a summer rally to about SPX 3040. Int rates may stabilize if stocks falter into May, but an economic rebound late Q2 will likely push rates higher. Gold/miners is a wildcard here, but a mild pickup in inflation may cause a surprising downside reaction.
Weekly Trade Alert. Last weeks SPX target of 2910-20 still looks valid with an ideal of 2915. Volatility to start the week may increase SPX put support below 2900, but currently options OI shows there is an air pocket down to 2850 for the week that could cause a sharp reversal starting Wed. Weakness is possible into the end of month toward 2800. Updates @mrktsignals.
Investment Diary, Indicator Primer, update 2018.03.28 Dumb Money/Smart Money Indicators
Article Index 2019 by Topic
Article Index 2018 by Topic
Article Index 2017 by Topic
Article Index 2016 by Topic
Long term forecasts
© 2019 SentimentSignals.blogspot.com
No comments:
Post a Comment