
For the SPX, prices continue to follow the Jun 2018 period of a rounded top, Options OI indicate that next week will continue to do so, with another move over 2910 possible on Mon, a target for Wed of about 2900 and then 2875 looks probable by Fri.
This week will look back to mid 2017 as some of the indicators are showing signs of sentiment alternation between the periods before the Jan 2018 top and the Oct 2018 top.
The article index for 2019 has been updated.
I. Sentiment Indicators
The overall Indicator Scoreboard (INT term, outlook two to four months) bearish sentiment is starting to look more like Dec 2017 than Oct 2018. This could be alternation for an upcoming market top, meaning that a blow off type top may happen, possibly due to a trade deal with China in May.

The INT view of the Short Term Indicator (VXX+VXXB $ volume and Smart Beta P/C, outlook two to four months) bearish sentiment has reached the lowest of the last two years. Sentiment reaction to the next pullback may indicate the nature of the next rally, as a BUY spike preceded the Oct 2018 runup, while Jan 2018 blow off saw weak preceding bearish sentiment.

Bonds (TNX). Interest rates appear to have broken out of the INT consolidation with a blow off low and now may be preparing for a sharp runup in rates. Bearish sentiment showed a sharp drop on Thur as the volume in TLT swelled to 4 X the daily avg. This increases the chances of a sharp runup in rates if a China trade deal is done or if "green shoots" of economic growth appear in June-July.

For the INT outlook, the gold miners (HUI) bearish sentiment rose sharply as the apparent H&S now looks valid, but as seen in the LT chart, this may be a reaction of the test of a two year downward sloping channel.

I was very bullish on gold/miners in 2000 after a multi year basing around $300 and again on the miners late 2015 when bearish sentiment was off the chart, but for the LT, sentiment remains a long way from a BUY.

II. Dumb Money/Smart Money Indicators
For this week and possibly for the next several months, I am going to replace the DM/SM ETF indicators with other indicators.
The option-based Dumb Money/Smart Money Indicator as short/INT term (outlook 2 to 4 mns/weeks) remains low similar to the June 2018 top.

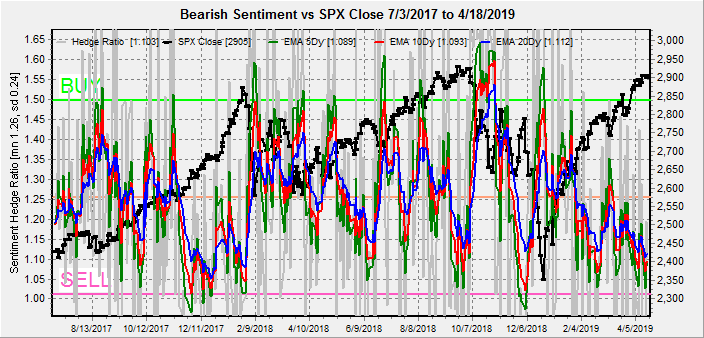
And the sister options Hedge Ratio sentiment is somewhat in between that seen of Jan and June of 2018, similar to the Oct 2018 top. Lack of hedging can mean more volatile corrections.
The INT term SPX Long Term (2x/DM) ETFs (outlook two to four weeks) bearish sentiment is low, but not at the level of major tops.

The INT term NDX Long Term (2x/DM) ETFs (outlook two to four weeks) bearish sentiment is much more like June 2018 than preceding the Jan top.

Finally, the Safety Trade Indicator (SPX/TNX ETFs) saw a large spike with a strong move into bonds usually preceding a bottom in stocks and supports the melt up or blow off top scenario.

III. Options Open Interest
Using Wed close, remember that further out time frames are more likely to change over time, , and that closing prices are more likely to be effected. This week I will look out thru Apr 30. Also, This week includes a look at the TLT thru Jun.
With Fri close at SPX 2905, Mon shows strong put support at 2900 and lower, while call hedging may push the SPX to 2920 intraday, but is likely to reverse by the close. Moderate open int overall.

Wed shows strong call resistance at SPX 2910 with little put support until 2885. A close at or below SPX 2900 is likely

For Fri, call resistance could push SPX prices down toward put support at 2850. As we have seen the last few weeks, however, addl puts may be added during the week.

For the EOM, currently shows the possibility of an SPX drop to 2800-25 due to call resistance at 2825 and 2850 if prices fall below put support at 2875. Strong call resistance is at 2900.

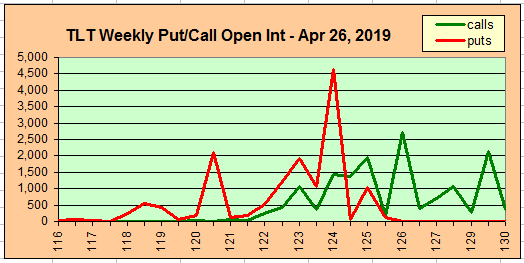
The TLT 20 year bond fund is used as a proxy for interest rates. For the last several years when the TNX was 112 when the TNX was 3.2% (11/2018), the TLT was 124 when the TNX was 2.5% (12/2017), and the TLT was 140 when the TNX was 1.5% (08/2016).
Currently the TLT is 122.9 with the TNX at 2.56%. Since the Twitter update predicted a weekly close of 123, I may start providing weekly outlook updates. For Apr 26, put support should lift prices to 124.
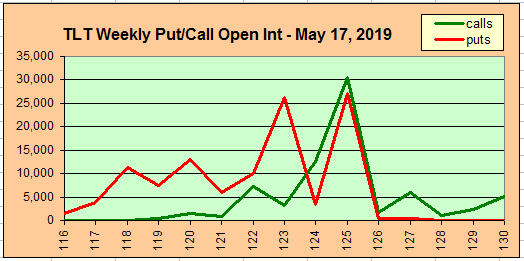
For May monthly exp, large put support rises to 125, but is offset by call resistance. Close likely between 124-5. This seems to correspond to a pullback in stocks to mid May, increasing safe haven demand for bonds.
for Jun monthly exp, very large put support moves up to 120 with moderate call resistance at 122 and a likely close at 120-122.

IV. Technical / Other
Early last week continued to show huge VIX put buying, pushing the VIX Put Indicator to an +83% rise of the mean or about the same as June 2018. However, this is a "weak" indicator compared to the VIX Call Indicator which rose only 24% of mean compared to June 2018, when it rose 36%. Therefore, a 2% decline may be all that is seen.

Conclusions. Overall bearish sentiment for the SPX continued to fall last week that oddly may indicate a milder pullback into mid May then a blow off top similar to Dec 2017-Jan 2018. A possible cause is a positive outcome from the China trade talks. The constant addition of puts OI for the SPX during the week may also continue to cushion the SPX. Last weeks surge of buying in the TLT may also be an indicator of misplaced fear. The main difference between my primary outlook of a pullback into to mid May to 2800+ is mainly one of degree as the upside target is still SPX 3000+ by summer.
Weekly Trade Alert. Mon may again see a retest of the upper target of SPX 2910-20 with a current target of 2875 by late in the week. Updates @mrktsignals.
Investment Diary, Indicator Primer, update 2018.03.28 Dumb Money/Smart Money Indicators
Article Index 2019 by Topic
Article Index 2018 by Topic
Article Index 2017 by Topic
Article Index 2016 by Topic
Long term forecasts
© 2019 SentimentSignals.blogspot.com
No comments:
Post a Comment