In the two weeks leading up to options exp (Nov 19), the vast majority of analysts had upped their year-end target for the SPX to 4900-5000. At the same time, I had been warning the SPX was likely to top out and retest the Sept highs (4550-600) by early Dec. Admittedly my INT target of 4650 was easily exceeded with the breakout over 4700 and even the ST target of 4720-30 was briefly exceeded (4744) the 1st hour of trading Mon on the news of the re-nomination of Powell as Fed head. However, thereafter the SPX wasted no time in reversing as expected, dropping over 80 pts the next 24 hours and dropping below 4600 by Fri close.
Unfortunately, for this weeks update the rapidity of the decline has outrun the INT/LT indicators which show little change and only the ST Indicator reflects the market weakness. So it is possible the decline will continue with a pause likely at the 50 day SMA (SPX 4630ish), but just as likely is the expected scenario of a bottom the next week or so and a Xmas rally that retests the 4700+ area before a larger decline. I have no way of predicting the effects of the Omicron coronavirus variant and therefore must allow for greater uncertainty.
I. Sentiment Indicators
The INT/LT Composite indicator (outlook 3 to 6+ months) has three separate components. 1st is the SPX and ETF put-call indicators (30%), 2nd the SPX 2X ETF INT ratio (40%), and 3rd a volatility indicator (30%) which combines the options volatility ratio of the ST SPX (VIX) to the ST VIX (VVIX) with the VXX $ volume.
We saw a slight bounce in the INT/LT Composite last week, but it remains near record lows.

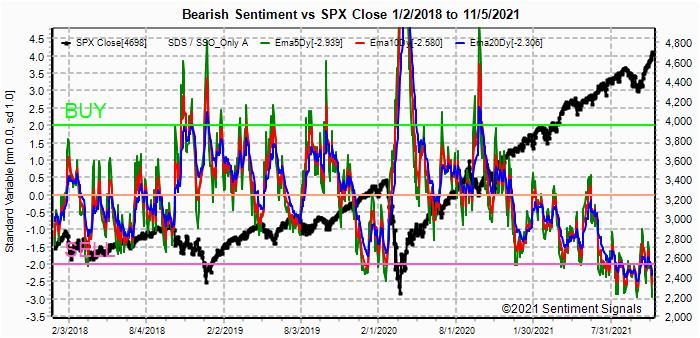
The ST Composite as a ST (1-4 week) indicator includes the NYSE volume ratio indicator (NYDNV/NYUPV & NYDNV/NYDEC) and the VXX $ Vol/SPX Trend. Weights are 80%/20%.
Sentiment for the ST Composite bounced strongly and appears to be following the Aug-Seot 2020 pattern where a pause was seen before lower lows then a rally to retest recent highs.

The ST/INT Composite may also be following the Aug-Sept 2020 pattern, but remains much weaker at this point.

Compared to Aug-Sept 2020, sentiment is only about 50% as strong, raising questions about the durability of any ST bottom.


The HUI did briefly rally over the 240-260 INT consolidation range as expected, but last week retreated back into the trading range.

II. Dumb Money/Smart Money Indicators
This is a new hybrid option/ETF Dumb Money/Smart Money Indicator as a INT/LT term (outlook 2-6 mns) bearish sentiment indicator. The use of ETFs increases the duration (term).
Looking at the DM/SM sentiment using EMAs, a slight bounce was seen last week.


III. Options Open Interest
Using Thur closing OI, remember that further out time frames are more likely to change over time, and that closing prices are more likely to be effected. Delta hedging may occur as reinforcement, negative when put support is broken or positive when call resistance is exceeded. This week I will look out thru Dec 3.
With Fri close at SPX 4595, options OI for Mon is moderate and the P/C is very high. Below 4600, the next level of support is 4575 and the high P/C indicates the likelihood of a rally possibly to 4650 if 4575 holds.


IV. Technical / Other
N/A
Conclusions. The biggest surprise last week was the overall volatility. Last weeks Tech/Other section discussed the weak Adv/Dec volume and Mon was a perfect example of the result when after the initial hour of buying/short covering on news of Powell's continued leadership at the Fed, there was no support when profit taking began and the SPX fell 2% by Tue AM. A full test of the Sept high breakout (4546) or lower is possible, but a bounce next week could put off lower lows until the following week.
Weekly Trade Alert. Most of the downside target (4550-600) has been met, and sentiment is showing little support for anything other than a very ST bounce. Updates @mrktsignals.
Investment Diary, Indicator Primer,
update 2021.07.xx Data Mining Indicators - Update, Summer 2021 (in progress),
update 2020.02.07 Data Mining Indicators,
update 2019.04.27 Stock Buybacks,
update 2018.03.28 Dumb Money/Smart Money Indicators
Article Index 2019 by Topic, completed thru EOY 2020.02.04
Article Index 2018 by Topic
Article Index 2017 by Topic
Article Index 2016 by Topic
Long term forecasts
© 2021 SentimentSignals.blogspot.com