Last year at this time most were expecting a strong start and finish for 2022. while I was expecting the beginning of a multi-year bear market, but the outlook for 2023 is more murky. The 2022 ST outlook for the early Jan OI was a positive start over SPX 4800, but an EOW drop to 4700, exactly as happened. Next weeks outlook is for a weak start and a strong finish with strong bearish sentiment in OI positions. Further out the sentiment picture is made less clear with extreme positioning by both the bulls and bears, perhaps this just a reflection of the times as the far right and far left political agendas each seem to be gaining more power and the middle class is split between the super rich and the super poor with growing homelessness, looting and shoplifting.
Last weeks outlook was a draw with some initial weakness followed by late week strength was expected, and early weakness did appear, but there was little follow thru to the upside with the close for the weeks SPX -5 pts following the previous weeks decline of -7 pts. I had warned of an expected trading range until the mid-Jan earnings season and inflation news and the SPX seems to be forming a triangle. To me the most likely outcome INT is an extended trading range with a weak upward bias to frustrate both bulls and bears. The biggest concern remains interest rates as governments embrace the "give away" fiscal policy which only increases borrowing and offsets the CB's rate hikes.
I. Sentiment Indicators
The INT/LT Composite indicator (outlook 3 to 6+ months) has three separate components. 1st is the SPX and ETF put-call indicators (30%), 2nd the SPX 2X ETF INT ratio (40%), and 3rd a volatility indicator (30%) which combines the options volatility ratio of the ST SPX (VIX) to the ST VIX (VVIX) with the UVXY $ volume.
Update Alt. In this case the wts for the SPX 2X ETF ratio (SDS/SSO) and SPX puts & calls spread are adj to equal as in the DM/SM section for SPX ETFs.
A mixed bag as higher volatility and SPX ETF sentiment offset lower options sentiment.


Update. Very little improvement here with a weak Sell.

Update EMA. Very ST, weakness or volatility is expected.

Update EMA. The ST/INT sentiment is becoming more positive due to the Hedge Spread and a ST breakdown is possible before a strong reversal.


Update. Prices remain in a range as is sentiment. Two factors I had previously discussed for gold & gold stocks are China's SSEC and 1/TNX and recently the SSEC has been a positive factor (hopefully I will show in next weeks Tech/Other).

II. Dumb Money/Smart Money Indicators
This is a new hybrid option/ETF Dumb Money/Smart Money Indicator as a INT/LT term (outlook 2-6 mns) bearish sentiment indicator. The use of ETFs increases the duration (term).
Update. Another indicator that may mean ST weakness.


The NDX bearish sentiment is the highest of the last 5 years
as prices test the Sept lows (a possible double bottom?), with a strong increase
in ETF options sentiment and ETF sentiment the same as at the Sept NDX lows.

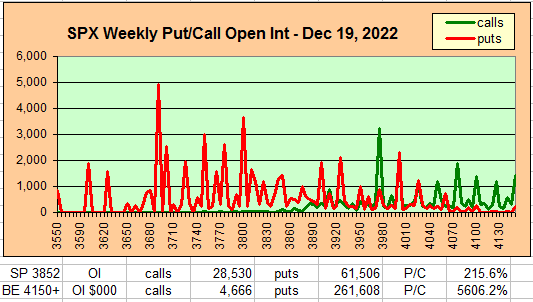
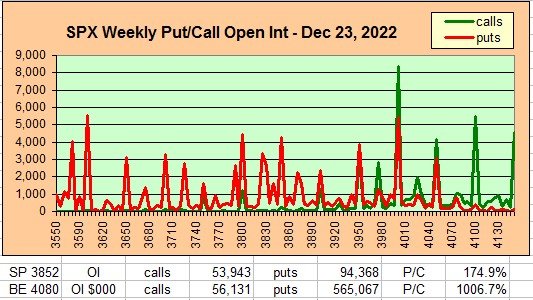
III. Options Open Interest
Using Thur closing OI, remember that further out time frames are more likely to change over time, and that closing prices are more likely to be effected. Delta hedging may occur as reinforcement, negative when put support is broken or positive when call resistance is exceeded. This week I will look out thru Jan 6. A text overlay is used for extreme OI to improve readability, P/C is not changed. Also, this week includes a look at the GDX for Dec exp. A new addition is added for OI $ amounts with breakeven pts (BE) where call & put $ amounts cross.
With Fri close at SPX 3840, options OI for Tue is small with call resistance at 3875 and little support until 3800 or lower as 3800 and 3850 are straddled so a close near the mid-point is likely.


IV. Technical / Other - NA
Conclusions. A somewhat weaker than expected outlook to the week, but withhin reason. The Wall Streets siren song to "Buy bonds and Sell stocks" lost some of its luster last week as bonds joined stocks with at 50%+ retrace from the Sept lows, but the questions remains as to how the second recommendation will fare. Last weeks options OI for TLT showed what appeared to be smart money puts at 95 for Mar exp, but the 5 pt drop to 100- for the week was a surprise and the sharp rise in rates put pressure on stocks, but is likely to stabilize ST and may allow stocks to rally.
Weekly Trade Alert. Some weakness is expected early with a possible retest of recent lows, but a strong finish to the week toward 3900 is expected by Fri close. Updates @mrktsignals.
Investment Diary, Indicator Primer, Tech/Other Refs,
update 2021.07.xx Data Mining Indicators - Update, Summer 2021,
update 2020.02.07 Data Mining Indicators,
update 2019.04.27 Stock Buybacks,
update 2018.03.28 Dumb Money/Smart Money Indicators
Article Index 2019 by Topic, completed thru EOY 2020.02.04
Article Index 2018 by Topic
Article Index 2017 by Topic
Article Index 2016 by Topic
Long term forecasts
© 2022 SentimentSignals.blogspot.com