
I. Sentiment Indicators
The overall Indicator Scoreboard (INT term, outlook two to four months) bearish sentiment continues its modest rise still similar to Jun-July 2018 and Jan-Feb 2020. Expecting at least one more rally phase after pullback completes.

The INT view of the Short Term Indicator (VXX $ volume and Smart Beta P/C [ETF Puts/Equity Calls], outlook two to four months) bearish sentiment continues its modest rise similar to Jan-Feb 2020. Expecting at least one more rally phase after pullback.

Bonds (TNX). Does any one remember that the promise of MAGA was to return the USA to the 4-6% growth rates in GDP seen in the 1980s & 90s which is why interest rates rose the 1st two years of the Trump regime. The results have been anything but what promised, as first a global trade war cut GDP growth in half then the mismanaged pandemic has sent growth and int rates to historic lows.

For the INT outlook with LT still negative, the gold miners (HUI) bearish sentiment remains at extreme low levels as prive consolidates between 260-280.

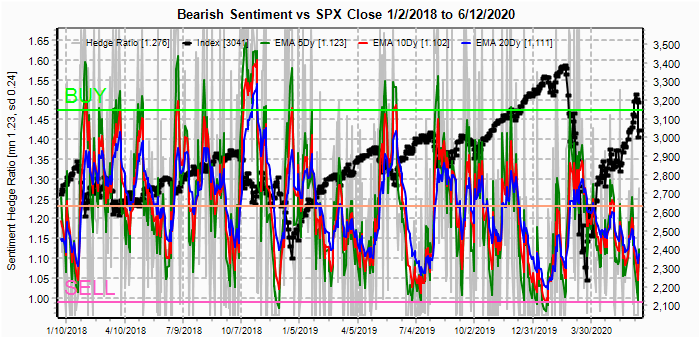
II. Dumb Money/Smart Money Indicators
The option-based Dumb Money/Smart Money Indicator as short/INT term (outlook 2 to 4 mns/weeks) bearish sentiment is very low but approaching the May consolidation levels.

And the sister options Hedge Ratio bearish sentiment is rising but not to levels yet that would support a substantial rally.

III. Options Open Interest
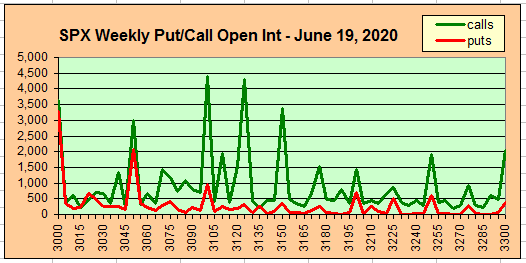
Using Thur closing OI, remember that further out time frames are more likely to change over time, and that closing prices are more likely to be effected. Delta hedging may occur as negative reinforcement when put support is broken or call resistance is exceeded. This week I will look out thru July 2. Also, this week includes a look at the GDX for July exp.
This week is unusual with 4 trading days (July 3 closed, July 2 closes early) and 4 options exp days including June 30 EOM.
With Fri close at SPX 3009, options OI for Fri showed very large support at 3015 and below and large support at 3050, so the low close was a sign of weakness,

Mon has only small OI with some support at SPX 3000. We may see an opening spike to 2980s then begin a reversal.

Tue, EOM, has very large OI at SPX 3050 and below, so a potential reversal on Mon could push to 3050 or higher.

Wed has small OI, but there is almost no call resistance to the 3100 area, so a continued push higher is possible.

For Thur, out support is only moderate, starting at SPX 3050, so any rally during the week will likely retreat to that level.

Using the GDX as a gold miner proxy closing at 35.20, any push higher will find strong strong call resistance, while put support starting at 34 will likely limit any downside.

Currently the TLT is 165 with the TNX at 0.64%. The TLT is pushing against strong call resistance.
IV. Technical / Other - N/A
Conclusions. Stock markets have moved down to the lower portion of the trading range indicated last week of SPX 2980-3180, where 2980 is the 50 day SMA. If the 50 SMA does prove to be support, this may imply an EW triangle for much of July as the 50 SMA provides rising support. Next week should provide some resolution as to whether we see a pullback with lows just below SPX 3000 or a more serious correction that could reach the 2800 level. Options OI indicates that the pullback option is more likely.
Weekly Trade Alert. A bounce is likely mid-week that may see weakness early Mon followed by a move up to or over SPX 3050 with some weakness by Thur's early close before a long weekend. Updates @mrktsignals.
Investment Diary, Indicator Primer,
update 2020.02.07 Data Mining Indicators,
update 2019.04.27 Stock Buybacks,
update 2018.03.28 Dumb Money/Smart Money Indicators
Article Index 2019 by Topic, completed thru EOY 2020.02.04
Article Index 2018 by Topic
Article Index 2017 by Topic
Article Index 2016 by Topic
Long term forecasts
© 2020 SentimentSignals.blogspot.com


