
Fedphoria. The last time Wall St was this optimistic about the Fed ("the Sept pause") was the Feb-Mar lows at SPX 4100+ before a two and a half week rally of 500+ pts to 4640, but soon after, the Fed heads starting backtracking and so did the SPX all the way to the June lows of 3640. What seemed to kick off the rally Tue was likely oversold ST sentiment indicated by the ST Composite and VIX call indicator into the target SPX 3750-800 area, but a double whammy of weaker than expected PMIs and UMich consumer confidence Thur/Fri lead Wall St to conclude that the Fed may end rate hikes by Sept and start lowering rates early 2023. What seemed to be glossed over was that the UMich inflation expectations, which dropped from 5.4% to 5.3% annualized, still much too high for the Fed to assume that inflation is over.
As the SPX consolidated Tue/Thur in the 3750-800 area ST bearish sentiment remained very high as shown by the ST Composite and VIX call indicators with strong Buys. Even Fri leap to SPX 3900+ left the indicators in Buy mode and I am raising my VST targets (June 30 EOM) to 4100+. After that a pullback to the May lows around SPX 3810 seems likely before a move higher into mid-July (possible 4300+). The next Bradley turn date (major) is July 15, so that is likely to be a high +/- a couple days.
The Tech/Other takes a look at the options CPCRevised (Equity+SPX+ETF) and Vix call indicator.
I. Sentiment Indicators
The INT/LT Composite indicator (outlook 3 to 6+ months) has three separate components. 1st is the SPX and ETF put-call indicators (30%), 2nd the SPX 2X ETF INT ratio (40%), and 3rd a volatility indicator (30%) which combines the options volatility ratio of the ST SPX (VIX) to the ST VIX (VVIX) with the UVXY $ volume.
Update 2X ETFs. Bearish sentiment has backed off recent highs, but still at a Buy.


Update. Bearish sentiment remains very strong, mainly from NYSE vol data as UVXY $ vol has dropped sharply and may indicate some pickup in volatility ahead.

The ST/INT Composite indicator (outlook 1 to 3 months) is based on the Hedge Spread (48%) and includes ST Composite (12%) and three options FOMO indicators using SPX (12%), ETF (12%), and Equity (12%) calls compared to the NY ADV/DEC issues (inverted). FOMO is shown when strong call volume is combined with strong NY ADV/DEC. See Investment Diary addition for full discussion.
Update EMA (base data 2018-22). Bearish sentiment fell sharply last week and is now near neutral.

Bonds (TNX). The spike in bearish sentiment in bonds was followed by a sharp drop in rates last week Tue-Thur with the TNX falling from 3.5% to 3.0% before reversing on Fri.

Update. Bearish sentiment remains low and the HUI is likely to be range bound,

II. Dumb Money/Smart Money Indicators
This is a new hybrid option/ETF Dumb Money/Smart Money Indicator as a INT/LT term (outlook 2-6 mns) bearish sentiment indicator. The use of ETFs increases the duration (term).
Update. Bearish sentiment fell sharply back to neutral and 3/4 positive days may send sentiment back to recent lows that could lead to a ST pullback.


III. Options Open Interest
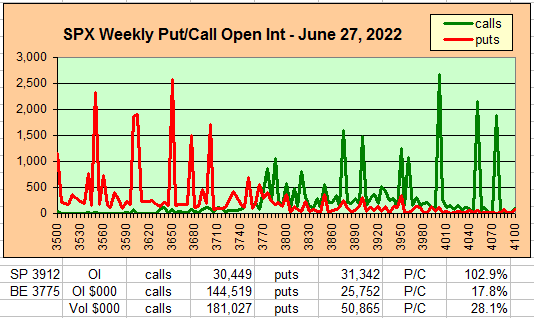
Using Thur closing OI, remember that further out time frames are more likely to change over time, and that closing prices are more likely to be effected. Delta hedging may occur as reinforcement, negative when put support is broken or positive when call resistance is exceeded. This week I will look out thru July 1. A text overlay is used for extreme OI to improve readability, P/C is not changed. Also, this week includes a look at the GDX and TLT for JUly exp. A new addition is added for OI $ amounts with breakeven pts (BE) where call & put $ amounts cross plus $ volume.
Fri AM, SPX options OI showed fairly strong call resistance over 3800 with a fairly low P/C and a BE at 3800 so the move to 3900+ was unexpected although supported by other sentiment..


Using the GDX as a gold miner proxy closing at 29.7, there could be positive bias toward the 32 level..

Currently the TLT is 112.6 with the TNX at 3.12%, the large amount of calls over TLT 115 (TNX 3.0%) may limit upside and put support is at 108 (TNX 3.5%) so prices may stay range bound (108-115).

IV. Technical / Other
This week I wanted to take a brief look at the Combined Put-Call Revised indicator (Equity + ETF + SPX), call buying is down sharply showing less speculation, mainly from less equity call buying, but low put buying indicates low fear levels.

While the ST VIX call indicator remained high thru Thur, however, the move to SPX 3900 caused a sharp reversal, but still a long way to go for a Sell.

Conclusions. The expected summer rally got off to a bang last week with the SPX up almost 6% and the NDX up 10%. ST and INT bearish sentiment are in position to support more rally ST before a pullback with SPX 4100 the likely target ST (50 SMA is 4060). July 15 now looks like a probable top for a swing high at the Bradley turn date (major). I think there may be a cycle inversion as a major breakdown was seen at the June 7 turn (med) so a higher low may occur at the next low (major). For the INT outlook the preferred rally into a Sept-Oct high is looking more likely with several macro factors influencing how high.
Weekly Trade Alert. Although not as high as expected several weeks ago (SPX 4300), a strong rally is expected to continue into EOM June 30 to about SPX 4100 with a short but sharp decline to follow. Updates @mrktsignals.
Investment Diary, Indicator Primer, Tech/Other Refs,
update 2021.07.xx Data Mining Indicators - Update, Summer 2021,
update 2020.02.07 Data Mining Indicators,
update 2019.04.27 Stock Buybacks,
update 2018.03.28 Dumb Money/Smart Money Indicators
Article Index 2019 by Topic, completed thru EOY 2020.02.04
Article Index 2018 by Topic
Article Index 2017 by Topic
Article Index 2016 by Topic
Long term forecasts
© 2022 SentimentSignals.blogspot.com


