Saturday, June 29, 2019

Go Draghi !

In one of his more inane remarks, this week POTUS in continued defamation of Fed head Powell remarked that he should be replaced by EU CB head Mario Draghi due to Draghi's remarks that more stimulus may be needed for the EU.  It took me all of two minutes to Google "EU economy" to see how Draghi has done.  Currently, comparing the US to the EU, on GDP growth 2019 Q1 - US 3.1%, EU 1.5%, and on the jobs front US 3.6% unemployment, EU 6.5%.  If the roles were reversed, Draghi would probably be jumping up and down for joy and Powell would be cutting rates as fast as he could.  POTUS is probably just upset ar Powell not having his back in combating the evil Chinese if they don't cooperate.  I think I would rather stick with Powell.

Looking at the market's performance last week the minor pullback at the EOM is looking more like 1987, where a small pullback at the end of June was followed by higher highs in July, another small pullback then a melt up in Aug, than 2015, where the rally off a 38% retracement was followed by a volatile period leading to a retest before the distribution rally into May.  Sentiment is also pointing in this direction and is highlighted in the Tech/Other section, where a followup of the data mining into the P/C ratios looks at the Smart Beta P/C (ETF puts/Equity calls) and shows why a melt up is consistent with other recent tops.

This week, I am converting to the new graphics update, but the only apparent differences are a slightly lighter background and tighter spacing of the legends.  Everything worked OK except for HUI and BKX charts, so the HUI was done with the old software.

I. Sentiment Indicators

The overall Indicator Scoreboard (INT term, outlook two to four months) bearish sentiment continues to fall, but at a slowing rate, indicating that a multi month topping period as in 2015 or Jul-Oct 2018, or a sharp advance as in Jan 2018 or Mar-Apr 2019 is likely before a top is in.


The INT view of the Short Term Indicator (VXX+VXXB $ volume and Smart Beta P/C [ETF Puts/Equity Calls], outlook two to four months/weeks) bearish sentiment is nearing recent extremes, but it is interesting to note that the pattern since late 2017 is more extremes in low bearish sentiment before bigger declines.  Does this indicate a megaphone pattern?


Bonds (TNX).  Interest rates.  We saw almost a year of high bearish sentiment from late 2017, so I guess the drop in rates should not be unexpected, but risks for bond holders abound as a China trade settlement could reverse the current economic slowdown, while impending food shortages from the mid west could dramatically increase inflation in food and gas (ethanol).


For the INT outlook with LT still negative, the gold miners (HUI) bearish sentiment has now fallen to extremes that marked tops/near tops since mid 2017.  I missed this one, as the second spike in bearish sentiment in May produced a much stronger reaction than the one in Sep 2018.


II. Dumb Money/Smart Money Indicators

For this week and possibly for the next several months, I am going to replace the DM/SM ETF indicators with other indicators.

The option-based Dumb Money/Smart Money Indicator as short/INT term (outlook 2 to 4 mns/weeks) has shown a sharp drop that is more similar to Dec 2017 than to the rallies into the gradual topping leading into the Oct 2018 and Apr 2019 tops..


And the sister options Hedge Ratio sentiment is following a similar pattern and again may be implying a Dec 2017 type setup.


The INT term SPX Long Term (2x/DM) ETFs (outlook two to four wks/mns) bearish sentiment is falling more slowly and indicates that ETF investors are slow to embrace this rally, so we are unlikely near an important top.


The INT term NDX Long Term (2x/DM) ETFs (outlook two to four wks/mns) bearish sentiment is even less enthusiastic than the SPX ETFs.  One possible outcome here is that the gov't investigations into monopolistic behavior absolves the big techs (so they can compete with Huawei) causing a buy spike later this summer.


III. Options Open Interest

Using Wed close, remember that further out time frames are more likely to change over time, and that closing prices are more likely to be effected.  This week I will look out thru Apr 30. Also, This week includes a look at the TLT thru Jun.

Fri close at SPX 2942 leapt over the 2925 resistance with leaked news of China trade progess as Trump gave Huawei access to US tech to restart trade talks.  For the week M/W/F are similar with moderate open int, all showing strong call resistance at 2950 so its difficult to say how much progress will be made during the week.


Wed, about the same.  A strong move over 2950 could go to 3000.


For Fri, if over 2950, 3000 is possible, but more likely a close below 2950.


Using the GDX as a gold miner proxy, now at 25.5.  For Jul exp, if GDX makes it over 26 there is little resistance above.  There is little put support, so a reversal below24 seems likely.  Progress in trade talks may dampen the demand for gold/stocks.


IV. Technical / Other

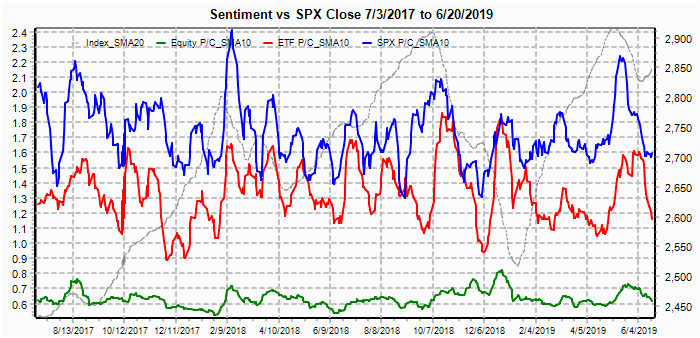
Last week, I showed a preview of the charting interface I built to datamine the indicators I have developed, mainly to see how they work and if the can be improved, but also to understand why they son't work sometimes such as the DM/SM ETF indicators.  During the week I added the individual put/call categories and want to use that as a followup of last week's ratio comparison which showed that the ETF P/C seemed to be the best at identifying market tops.

More specifically, looking at the puts and calls separately the ETF put levels were more important, as are equity calls and together they make up the Smart Beta P/C.  Individually they are shown back to Jul 2017.  Each of the last three corrections were identified by spikes in equity calls (grn) and a collapse in ETF puts (red) although the timing has varied by a few weeks.  For the Jan 2018 top. ETF puts bottomed in mid Dec 2017, while equity calls peaked at +2 SD in late Jan.  For the Oct 2018 peak, equity calls peaked over +2 SD at the Sep highs, while ETF puts bottomed at the Sep high.  For the Apr 2019 high, puts and calls both reached their extremes at the Apr high although equity calls only made it to +1.5 SD.  Currently ETF puts are near the lows of Dec 2017, but the equity calls are far from any of the previous tops for SPX, near the Nov-Dec 2017 levels.  This seems to imply that a melt up equivalent to Jan 2018 (+200 SPX pts) may be required to reach the same sentiment levels.


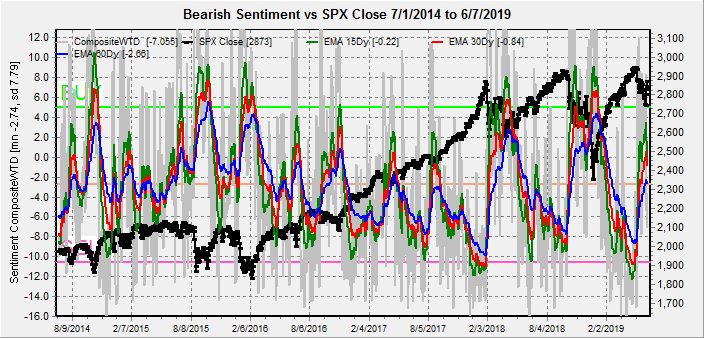
The following chart shows an overlay with the Smart Beta P/C (blue) that shows that more time (Jan 2018 top) or more extreme lows (Oct 2018, Apr 2019) is likely before a top.


Finally for comparison to the EMA model, where the 10 day EMA is about the same as the 10 day SMA/Std Var.


Conclusions.  An imminent collapse seems unlikely as sentiment has not reached the levels seen at major tops since 2017, but the question as to whether this evolves as a lengthy distribution top or a Jan 2018 type melt up is unclear, and I'm about 50/50 either way.  I have considered for several months now that one way out for Trump with the China trade situation is to offer a contingent plan to China where a 1 year trial period is used to see if enough progress is made for things like IP rights and other security issues.  This would allow the economy to recover before the election, and he could get tough again right before or after the election, if re-elected.  A sticky point is China's insistence of suspension of all tariffs before any agreement.

The Tech/Other section looks into the Smart Beta P/C components that show a sharp pickup in equity call buying is likely before a top is reached in the SPX.  Possible developments that could lead to this result are a China trade settlement, Fed rate cuts starting in July, and/or clearing of the giant techs of monopoly charges.

If the SPX continues to follow the 1987 analog mentioned above, we should see the SPX Approach the 3,000 area by July opt exp on the 21st, a pullback to 2950, then a 200 pt run up in Aug.  With the FOMC scheduled for Jul 30-1, this would fit in with a rate cut at that time.

Weekly Trade Alert.  Trumps caving on Huawei's access to US tech has probaby started the SPX move to 3000.  The alternation principle comparing the INT tops of Jan and Oct 2018 suggests that this top will be a melt up.  Options open int suggest little progress this week, but a rally toward SPX for the Jul 21 opt exp seems likely.  Updates @mrktsignals.

Investment DiaryIndicator Primer,  update 2019.04.27 Stock Buybacks, update 2018.03.28  Dumb Money/Smart Money Indicators
Article Index 2019 by Topic
Article Index 2018 by Topic
Article Index 2017 by Topic
Article Index 2016 by Topic
Long term forecasts

© 2019 SentimentSignals.blogspot.com

Saturday, June 22, 2019

Are Storm Clouds Approaching?

The last couple of weeks, the SPX has been following my outlook closely as first a rally to about 2925 was expected into the June FOMC and the triple witch optn exp (but no Fed rate cut) and lastly a range of 2850 to 2950 (Fridays close after a 2964 high).

Quarterly optn exp highs tend to be significant as the high volume is usually distribution, and last Fri at SPX 3B shares (stockcharts) was about 70% higher than the recent 1.8B avg.  The last comparable high was Sept 2018, where a 2-3% pullback was followed by a slightly higher high in Oct.  This years first half has been the best since 1987 which saw the high for the year in Aug before a pullback started.  We may see something similar this year.

Thanks for the positive comments the last two weeks.  Readership has picked up sharply recently to over 15k page views/mn, the AI bots must be watching me.  In the Tech/Other section this week, I will show the early stages of my graphic endeavor into data mining my indicator DB.


I. Sentiment Indicators

The overall Indicator Scoreboard (INT term, outlook two to four months) bearish sentiment has droped sharply, but longer EMAs (blue) may take a few weeks to reach a SELL level.


The INT view of the Short Term Indicator (VXX+VXXB $ volume and Smart Beta P/C, outlook two to four months) bearish sentiment has dropped even faster that may mean upside is limited or a short term pullback is likely.


Bonds (TNX).  Interest rates continue to fall, even though bearish sentiment is very low.


For the INT outlook with LT still negative, the gold miners (HUI) bearish sentiment is similar to bonds where demand for a safe have seems to be overpowering sentiment.


II. Dumb Money/Smart Money Indicators

For this week and possibly for the next several months, I am going to replace the DM/SM ETF indicators with other indicators.

The option-based Dumb Money/Smart Money Indicator as short/INT term (outlook 2 to 4 mns/weeks) has reached levels where  ST tops have been seen, but more time is likely needed before a significant decline starts.


And the sister options Hedge Ratio sentiment has fallen very sharply, most similar to what happened with the Nov trading range of SPX 2650-2800.  A possible current range of 2850-2950 may occur in a similar fashion.


The INT term SPX Long Term (2x/DM) ETFs (outlook two to four weeks) bearish sentiment does not appear to be low enough to indicate a top.


The INT term NDX Long Term (2x/DM) ETFs (outlook two to four weeks) bearish sentiment also seems to need a lower level to indicate a top.


III. Options Open Interest

Using Wed close, remember that further out time frames are more likely to change over time, and that closing prices are more likely to be effected.  This week I will look out thru Jun 28, EOM. Also, this week includes a look at the TLT thru Jul.

With Fri close at SPX 2950, Mon/Wed open int is unusually high, so may be more effective than normal.  There is very little put support until 2890 with fairly strong call resistance starting at 2950.  SPX 2925-40 looks like the most likely closing target.


Wed is even more bearish with very strong call resistance at SPX 2950 and little put support until 2875.  A continued downward push toward SPX 2900-10 is expected, depending on add'l open int added during the week.


Fri is the most bearish with very strong call resistance at 2925 and currently little net put support until 2850.  With the G-20 meeting this week in Japan concern may shift from the global CBs to US vs China over trade and Hong Kong.  A drop down to or below SPX 2900 is expected based on current positions.


The TLT 20 year bond fund is used as a proxy for interest rates.  For the last several years  when the TNX was 112 when the TNX was 3.2% (11/2018), the TLT was 124  when the TNX was 2.5% (12/2017), and the TLT was 140 when the TNX was 1.5% (08/2016).

Currently the TLT is 131.4 with the TNX at 2.7%.  For Jul, incredibly huge put support below 129 likely guarantees that rates don't rise much over the next month, while modest put support over 132 may keep rates from falling.


IV. Technical / Other

I'm going to show a little background for my graphics interface to the main DB that I will be using for some data mining from time to time.  So far I have added most of the put call ratios I use plus some of the indicators from the overall composite.  First, looking at the three main P/C ratios as raw data, you notice that Equity P/C (green) is very low as most of the "long" option positions are in individual stocks, while "short" positions use ETFs (red) for hedging and SPX (blue) for "short" speculation. But comparison is difficult due to size differences and volatility.  Data is only thru Thurs.


So next to reduce the volatility, I used the 10 day SMA and 20 day for the index.  Much easier to read, but still hard to compare.


So finally, I standardize by subtracting the mean and dividing by the std dev.  It's still hard to draw definite conclusions, but ETF P/C appears to be the best at identifying tops, while Equity and SPX are best at identifying bottoms.


For running the show, I created a console to select indicators for comparison and will probably be adding a lot more options.


Conclusions.  Overall bearish sentiment for the SPX has declined sharply with the rally over the last three weeks, but has not fallen to the level that indicates an INT top.  Comparisons to the triple witch tops of 2018 and 1987 indicate that a month or two may go by before a significant decline.  Draghi's "ready to do whatever it takes" ignited the markets Tue, but the underlying concern of why more support may be needed was unclear and reminds me of the adage that "when the US sneezes, the rest of the world catches a cold".  More significant economic risks may be lurking outside the US.

Weekly Trade Alert.  Next weeks G-20 summit may provide an excuse to start a 2-3% pullback toward the SPX 2850 level before a final push into Jul/Aug.  Updates @mrktsignals.

Investment DiaryIndicator Primer,  update 2019.04.27 Stock Buybacks, update 2018.03.28  Dumb Money/Smart Money Indicators
Article Index 2019 by Topic
Article Index 2018 by Topic
Article Index 2017 by Topic
Article Index 2016 by Topic
Long term forecasts

© 2019 SentimentSignals.blogspot.com

Saturday, June 15, 2019

The Calm Before . . .

Last week started with a bang with a move to SPX 2910 Tue AM, but ended with a whimper by staying in a 1% range.  Surprisingly, there was very little VIX compression with a range of 16.5 to 15.5.  Most traders appear to be expecting downside fireworks after the FOMC which was my take last week, but the continued relatively high bearishness in options positions indicates otherwise.

In my EOY Dec forecast, I looked at several indicators that pointed more to a 1998 LTCM outcome where a 20% decline saw a 25%+ rally into the 2000 top, rather than a full-fledged 2000-02 or 2008-09 bear market.  One indicator was LT volume analysis (NYAD/NYUD). which never gained the strength seen off the Aug 2015 and Feb 2016 lows.   This indicator is discussed in the Tech/Other section and now points to a May 2015 type top.  Another indicator, the $SKEW, has been consolidating in the low 110's - a warning level.

I. Sentiment Indicators

The overall Indicator Scoreboard (INT term, outlook two to four months) bearish sentiment has dropped down to neutral.


The INT view of the Short Term Indicator (VXX+VXXB $ volume and Smart Beta P/C, outlook two to four months) bearish sentiment seems to be going lower each INT top that may mean a larger decline is on the way, but does not appear to be imminent.


Bonds (TNX).  Interest rates are somewhat of a conundrum as low bearish sentiment does not seem to be having much effect.


For the INT outlook with LT still negative, the gold miners (HUI) bearish sentiment is similar to bonds that may be showing expected Fed rate cuts.


II. Dumb Money/Smart Money Indicators

It's been a few weeks since I looked at the DM/SM ETF indicators and this week I will take a brief look at the SPX ETFs.

The Risk Aversion/Risk Preference Indicator (SPX 2x ETF sentiment/NDX ETF sentiment, outlook 2 to 4 wks/mns) as a INT indicator has remained lower for longer, but considering that it was ultimately right in Q4 2018, bigger troubles may lie ahead.  Feb to Jun 2019 looks a lot like Jun to Oct 2018.


The option-based Dumb Money/Smart Money Indicator as INT term (outlook 2 to 4 wks/mns) dropped sharply early in the week, but has since returned to neutral and does not show significant risk.


And the sister options Hedge Ratio sentiment is somewhat less bearish as options-based hedging has only returned to neutral.


The INT term SPX Long Term (2x/DM) ETFs (outlook two to four weeks) bearish sentiment seems to be making lower highs and lows similar to the Risk Aversion Indicator and does not indicate high risk.


III. Options Open Interest

Using Wed close, remember that further out time frames are more likely to change over time, and that closing prices are more likely to be effected.  This week I will look out thru Jun 21. Also, This week includes a look at the GDX for Jul.

With Fri close at SPX 2887, Mon/Wed have light OI with Mon show a likely range of 2880-2900.


Wed as might be expected on FOMC day shows a wide potential range of 2820 to 2925.


For Fri, due to most options for SPX expiring AM, the PM shows a slightly bearish tilt below 2890, but likely above 2850.


Using the GDX as a gold miner proxy, now 23.33.  For Jul exp strong support appears at 20.5, while strong resistance is 24-5.  The likely range is 21-23.


IV. Technical / Other

The circled areas show a striking similarity between now and the May top of 2015 where the ST MAs dropped sharply as up vol dried up after an expended sideways period in the LT MAs.  This occurred 3 months before a sharp drop Aug 2015, so this may mean a distribution top for a couple of months before trouble in the late summer.


Conclusions.  Overall sentiment indicates the we may see a relatively calm summer, but late summer, early Fall may see a return to volatility.  With everyone focused on the Fed and China, I would not be surprised to see a dark swan appear from nowhere, possibly an Italian debt crisis or a unruly Brexit that drops the SPX toward the 2500 area by Oct.  At that point we may see the Fed step in, creating a similar setup to the Aug 2008 rate cut that was followed by a final top in Oct.

Weekly Trade Alert.  We may see a very ST top next week near SPX 2925 followed by a drop to 2850, but it looks likely that the next couple of months are likely to remain in a range of 2850-2950.  I have been upgrading my graphics software and looking at some new goodies, so don't expect a lot of updates on Twitter for a while.  Updates @mrktsignals.

Investment DiaryIndicator Primer,  update 2019.04.27 Stock Buybacks, update 2018.03.28  Dumb Money/Smart Money Indicators
Article Index 2019 by Topic
Article Index 2018 by Topic
Article Index 2017 by Topic
Article Index 2016 by Topic
Long term forecasts

© 2019 SentimentSignals.blogspot.com

Saturday, June 8, 2019

Bears Get Tranked

Last week I warned that overall sentiment was indicating a sharp rally was approaching, while SPX options OI indicated strong put support Mon at 2725 and puts at higher strikes could push prices over 2800 by the EOW.  The outcome surprised even me with a Mon low at 2728 and prices Fri pushing up to 2885 before a slight pullback.

Rehashing a chart that I have shown several times after warning of a possible V-bottom in Jan, we are again following closely the Oct 2014 V-bottom with a longer time frame, where a 38% rally retracement in Dec 2014 was followed by a very sharp rally to higher levels.


A continuation would lead to a top around FOMC 18-19, where I see a less than 25% chance of a change in policy due to high stock prices and an unemployment rate (UR) near all time lows at 3.6%.  As I pointed out in Dec, the last two rate cycles did not see a cut until the UR rose above 4%.  Additionally, the first cut represented a major LT SELL as in 2008 where the first cut was in Aug after a 10% correction and the markets topped in Oct, and in 2000 the first cut was in Dec several months after the markets topped.

Due to the similarities between 2019 and late 2014, I have to give a 50% probability of a 2015 type distribution top, especially with the rush into bonds.  However, my preference is to see a sequence of lower highs leading to a higher retest of the Dec lows before a rate cut cycle and then a retest of the Jan 2018 highs before a serious downturn, but only time will tell.

This week for the stock markets I am going to take a long term view from mid 2014 using 3x EMAs which shows weaker sentiment that may mean a weaker outcome than 2015.


I. Sentiment Indicators

The overall Indicator Scoreboard (LT term) bearish sentiment has seen a weaker move up than Dec 2014, similar to what was seen in early 2015.


The LT view of the Short Term Indicator (VXX+VXXB $ volume and Smart Beta P/C) bearish sentiment has moved up much less than the Dec 2014 38% retrace.  More volatility is expected.


Bonds (TNX).  Interest rates have been a major surprise as I expected a drop down to about 2.4-.5 on the TNX, but we are close to retesting the mid-2017 lows.  The public in particular has had enough of the volatility in the stock market.


For the INT outlook with LT still negative, the gold miners (HUI) bearish sentiment is nearing levels seen at recent highs, so that a sustained rally is unlikely.


II. Dumb Money/Smart Money Indicators

For this week and possibly for the next several months, I am going to replace the DM/SM ETF indicators with other indicators.

The option-based Dumb Money/Smart Money Indicator as LT term has risen to levels comparable to the Feb-Apr 2018 lows so may be more supportive LT.


And the sister options Hedge Ratio LT sentiment is virtually identical to the DM/SM indicator.


The LT term SPX Long Term (2x/DM) ETFs bearish sentiment has barely reached the neutral level, and combined with the options indicators and volume indicators in Tech/Other, indicate a rally fueled by ST short covering that is not likely to last.


The LT term NDX Long Term (2x/DM) ETFs bearish sentiment has risen to levels comparable to Feb-Apr 2018 and is likely to support further gains.


III. Options Open Interest

Using Wed close, remember that further out time frames are more likely to change over time, and that closing prices are more likely to be effected.  This week I will look out thru Jun 14. Also, This week includes a look at the TLT for Jun optn exp.

With Fri close at SPX 2873, both Mon/Wed are light open int.  Mon shows call resistance starting at 2850 so there may be some downward pressure toward 2850.  No put support until 2800.


Wed, although still light, shows more call downward pressure toward SPX 2830..


For Fri, with heavy open int, downward pressure should continue toward SPX put support at 2825 and call resistance starting at 2850.  This looks like a typical optn exp week setup, where a decline gets bears excited before a sharp rally into optn exp, possible target SPX 2925.


Currently the TLT is 131.7 with the TNX at 2.08%.  For Jun 21, put support is huge at 129 with only small call resistance above.


IV. Technical / Other

Another indication of a problem with this rally is the lagging NY Adv/Dec volume $NYUD compared to the NY Adv/Dec issues $NYAD.  Below you can see that the $NYAD has been strong,


But the $NYUD remains weak, indicating the rally is mostly short covering and is likely to be at least followed by a retest of the price lows.


Conclusions.  Overall, sentiment is more supportive of a short term rally, but not a LT move higher.  Similarities to the Oct 2014 rally continue to amaze, leaving the possibility open for a longer distribution top as in 2015 before a major leg down.  At least a ST top is expected by Jun 21 triple witch optn exp, a new recovery high above SPX 2950 supports the 2015 type top, while a lower high would be more ominous.  Either way an expected Fed disappointment is likely to lead to a retest of the recent lows.

Weekly Trade Alert.  Next week is likely to present a pullback to SPX 2825-50 with an options OI target Fri close at 2830-40.  A rally the following week is expected with a target of around SPX 2925, and the high for the week may be an important indicator for the INT outlook.  Updates @mrktsignals.

Investment DiaryIndicator Primer,  update 2019.04.27 Stock Buybacks, update 2018.03.28  Dumb Money/Smart Money Indicators
Article Index 2019 by Topic
Article Index 2018 by Topic
Article Index 2017 by Topic
Article Index 2016 by Topic
Long term forecasts

© 2019 SentimentSignals.blogspot.com