
Most of the sentiment indicators have reached levels seen at Apr retest lows, but a consolidation at lower price levels for 1-2 weeks is likely, possibly SPX 2400-2500. One scenario is an EOY rally followed by an early Jan retest of the lows. I've found only one analyst looking for higher prices in 2019, a true contrarian sign for higher prices.
I. Sentiment Indicators
The overall Indicator Scoreboard (INT term, outlook two to four months) bearish sentiment has risen to levels equal the Oct lows and midway thru the Mar-Apr retest. For a lasting bottom a rounded top in sentiment aka Apr is preferred.

The INT view of the Short Term Indicator (VXX $ volume and Smart Beta P/C, outlook two to four months) bearish sentiment has reached the highest levels since the Feb lows and may support a quicker turnaround than expected. Note the VXX ETN retires on Jan 29, 2019 and is to be replaced by a 30 yr VXXB, so there may be a ST reliability issue at that time.

Bond sentiment (TNX) continues to follow the June/July pattern that points to higher rates once the stock market turns around.

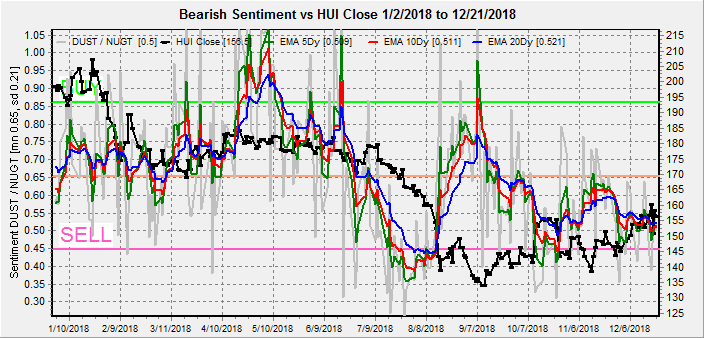
For the INT outlook with LT still negative, the gold miners (HUI) bearish sentiment remains unchanged while prices continue to fluctuate vs ST moves in the US dollar.
II. Dumb Money/Smart Money Indicators
The Risk Aversion/Risk Preference Indicator (SPX 2x ETF sentiment/NDX ETF sentiment, outlook 2 to 4 days/wks) as a INT indicator remains above neutral indicating modest preference for SPX to NDX.

The option-based Dumb Money/Smart Money Indicator as short/INT term (outlook 2 to 4 days/weeks) saw a sharp move up on Fri matching the first mid Mar low, so a couple weeks of volatility is probably needed for a strong rally.

The INT term SPX Long Term/Short Term ETFs (outlook two to four weeks) bearish sentiment actually turned down last week, but as the accompanying SDS/SSO ETF chart shows, dumb money (2x) selling has reached the extremes of the Oct lows and is midway between the Feb and Apr lows. The cause is high smart money selling, so volatility is likely to continue for a while.


Long term NDX Long Term/Short Term ETF Indicator (outlook two to four weeks) as the long cycle seems to follow prices, the short cycle is slightly lower. The LT chart shows price support around the 5800 level and is the only remaining negative sentiment indicator. Hard to tell if there will be a final flush lower of tax loss selling next week.

III. Options Open Interest
Using Thurs close, remember that further out time frames are more likely to change over time. This week I will look out thru Dec 31.
Mon/Wed are mostly puts from SPX 2350-2550 and show little directional bias. Light open int overall. No charts.
Fri has moderate open int showing below SPX 2400 next pivot is 2350, and above 2450.

Mon, Dec 31, is showing pretty much the same with larger open int, from SPX 2400, 2350 or 2450 is equally likely.

IV. Technical / Other
The overwhelming surprise that the Fed "stayed the course" was unexpected as it was what I was expecting all along. One indicator that has done an excellent job as a coincident (inverse) indicator of Fed rate changes over the past two int rate cycles is the unemployment rate (UR). As you can see below, the Fed tends to raise rates when the UR falls and lower rates when the UR rises. In the last two recessions the Fed had to lower rates by over 5% to create job growth, and this is why they are worried about stopping at 2.5%. The last time, rates were kept at 0% for 6 yrs until late 2015 when the UR fell to 5%. With current UR at 3.7% (same as 2000), Fed funds policy change is not likely until UR rises over 4%. UR data from Bureau Labor Statistics, Fed funds from St Louis Fed. Even though rates began to fall in late 2007, it still did not prevent the bear market in stocks continuing into 2009. Negative rates are possible, but have not been effective in the EU with UR stuck at 10%.

The TI Composite NYMO+TRIN+NYAD+NYYD has now fully reversed course from a strong SELL early Oct to a strong BUY, in between the Feb low and Mar-Apr lows, so a powerful reversal should be seen soon.

Have we seen capitulation yet? One of the volume indicators I created a year ago is the $NYDNV/$NYDEC as a Capitulation Indicator. We are now in between the levels of June 2017 which saw a SPX 450 pt rally after a slightly lower low two wks later and June 2018 which saw a SPX 350 pt rally after a low a few days later.

Historical context. The current decline continues to closely match the midterm-2010 scenario outlined in late Oct. Although currently deeper than originally expected, the 2010 decline was 17.1% over 3 months that would equate to SPX 2437 from 2941. The rally that followed into 2011 lasted 10 months that would be to Oct 2019. The following decline lasted 5 months and dropped 21.6% and from SPX 2830 (430 pt rally) that would be about 2200.
Conclusions. As expected last week options open int was little help last week other than the Mon flush to 2530. The sentiment picture is pretty clear with overwhelming evidence that a strong rally similar to the SPX 400+ pt rally from the Mar-Apr lows is near. From the current lows my target would be SPX 2800-50, creating a somewhat downward slanting H&S top from Jan and Oct. The NDX still looks to have more work needed on the downside and it is hard to tell if there will be quick lows from tax loss selling or on a later retest. In any event, there is no hurry to try to pick a bottom and the next two weeks are likely to be volatile.
Weekly Trade Alert. An early week decline in the NDX to 5800 (-3%) is likely to send the SPX to 2350 before a stronger bottom, and this should provide a buying oppty targeting SPX 2500+. However, a short covering rally can also start targeting the 2500 level by EOY or both. A more secure buying oppty is likely after the first of the year. Updates @mrktsignals.
Investment Diary, Indicator Primer, update 2018.03.28 Dumb Money/Smart Money Indicators
Article Index 2018 by Topic
Article Index 2017 by Topic
Article Index 2016 by Topic
Long term forecasts
© 2018 SentimentSignals.blogspot.com
No comments:
Post a Comment