I. Sentiment Indicators
The overall Indicator Scoreboard (INT term, outlook two to four months) bearish sentiment continues to rise nearing the levels of Mar 22.
The INT view of the Short Term Indicator (VXX $ volume and Smart Beta P/C, outlook two to four months) bearish sentiment is somewhat lagging the Mar retest.
But the Smart Beta P/C seems to be following the same pattern, but at slightly lower levels that may indicate a weaker rally (no ATH) if we have a Mar-Apr type bottom.
Bond sentiment (TNX) continues to waffle around the neutral zone indicating a likely trading range..
For the INT outlook with LT still negative, the gold miners (HUI) bearish sentiment remains low as the gold bugs keep preaching a collapse of the dollar.
II. Dumb Money/Smart Money Indicators
The Risk Aversion/Risk Preference Indicator (SPX 2x ETF sentiment/NDX ETF sentiment, outlook 2 to 4 days/wks) as a INT indicator has risen over neutral, but is unlikely to reach the early 2018 levels that resulted in a larger rally in NDX (20%) vs the SPX (16%).
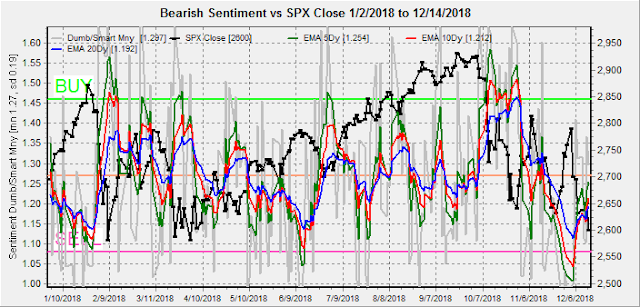
The option-based Dumb Money/Smart Money Indicator as short/INT term (outlook 2 to 4 days/weeks) remains at very low levels that may be distorted by put buying in FANGMAN stocks that declined 2x the SPX decline.
The INT term SPX Long Term/Short Term ETFs (outlook two to four weeks) bearish sentiment has been climbing steadily in the last decline as the dumb money (2x ETFs) are heavy sellers compared to smart money (3x ETFs).
This chart shows the INT term SPX Long Term/Short Term ETFs as of Mar 22 for comparison and you can see the levels are similar but slightly lower.
Long term neutral, the INT term NDX Long Term/Short Term ETF Indicator (outlook two to four weeks) as the long cycle seems to follow prices, the short cycle has turned down that may mean ST weakness..
III. Options Open Interest
Using Thurs close, remember that further out time frames are more likely to change over time. Last weeks dominance by puts showed early and late volatility, but strong support did hold by the close. This week I will look out thru Sept 21.
With Fri close at SPX 2600, Mon is dominated by puts with little directionality, but strong support at 2550 and little support until 2560. Light open int overall.
Wed is similar with inflection pts at SPX 2550, 2600 and 2625. No resistance until 2675.
Fri, optn exp, AM shows large open int mainly puts with inflection pts net at SPX 2550, 2600 and 2650.
For the PM, again mainly puts with inflection pts at SPX 2560 and 2640.
IV. Technical / Other
I am still not sure of the reliability of the NYMO+TRIN+NYAD+NYUD Composite as it was very early with a SELL late Aug, but other times has done much better. This indicator is also similar to the Mar 22 period.
Conclusions. So far bearish sentiment is not high enough to support a sustainable rally. Many are now expecting a crash down to the SPX 2400s, but with strong selling by dumb money (SPX 2x ETFs) a bottom is probably near. The replay of mid Mar-mid Apr for Dec seems a likely outcome as lows may be limited to SPX 2530-50 while whipsaws in a lower range could build up bearish sentiment.
Weekly Trade Alert. Options open int does show the possibility of a washout to SPX 2550 on Mon followed by a strong rally, but considering sentiment and similarities to Mar retest, my feeling is that bulls and bears may be whipsawed. One possibility similar to Mar is a down open on Mon to SPX 2575-85 followed by a strong rally thru FOMC Wed to 2675-85, then disappointment similar to the Dec trade talks that fades to new lows to 2530-60 by Fri/Mon AM then begin a choppy rally into mid Jan to SPX 2700-50. Updates @mrktsignals.
Investment Diary, Indicator Primer, update 2018.03.28 Dumb Money/Smart Money Indicators
Article Index 2018 by Topic
Article Index 2017 by Topic
Article Index 2016 by Topic
Long term forecasts
© 2018 SentimentSignals.blogspot.com


No comments:
Post a Comment