Saturday, May 11, 2024

Preparing for the Summer Doldrums

Last week was a miss as the SPX was expected to trade in the upper half of the recent range or 5100-50 with the caveat that a move in TNX to 4.4% could result in a gap fill at 5200 and good/bad news from the ME conflict could also affect prices.  As it turns out news of a brokered ceasefire by Egypt which was accepted by Hamas, but not fully by Israel, came out Mon and resulted in higher stock prices and lower TNX int rates down to 4.42% by Tue AM with SPX reaching 5200.  The rest of the week was somewhat confusing as int rates began to rise, closing virtually unchanged at TNX 4.5%, but strength in the DJIA helped the averages.  By Fri the DJIA closed its gap at 39.5k from early Apr, pushing the SPX to a high of 5240.  Possibly the move back over the SPX 50 SMA resulted in short covering from the "sell in May" crowd.

The big change sentiment last week was a large jump in the ETF putcall ratio to 2.86, the sixth highest since 2015.  Three of the higher ratios were in 2016, the first Trump run for POTUS, with one higher in each of 2017 and 2018.  As you can see in the charts below, this is not always a bullish indicator as the Mar 22 level of 2.38 only saw a sideways trend for over a week and was followed by the Apr 5% correction in SPX.

As mentioned last week I extended the HUI chart back to 2018 where you can see that there were several strong Buys for the ETF sentiment which seemed to be ineffective for the INT term, but were proven right eventually with the pandemic.  I think there may be one more correction to the HUI 200 level or below, but a catalyst is approaching that will trigger a large move upward.  The most promising possibilities seem to be policy changes with a Trump victory in the call for lower int rates and dollar, and higher tariffs.  A couple of articles discuss the possibilities ( Trump1 Trump2).


I. Sentiment Indicators

The INT/LT Composite indicator (outlook 3 to 6+ months) has three separate components. Starting Aug 26, 2023 SPX options are removed due to extreme 0DTE volume distortions. New weights are ETF put-call indicator (30%), SPX 2X ETF INT ratio (40%), and 3rd a volatility indicator (30%) which combines the options volatility spread of the ST SPX (VIX) to the ST VIX (VVIX) with the UVXY $ volume.

Update Alt, INT view. Bearish sentiment moved above neutral on Tue with a jump in ETF put/calls.

Update Alt EMA. Bearish sentiment spiked Tue to a weak Buy on a jump in ETF put/calls to a 5-year high, but closed the week slightly below neutral. The ST Composite as a ST (1-4 week) indicator includes the NYSE volume ratio indicator (NYDNV/NYUPV & NYDNV/NYDEC) and the UVXY $ Vol/SPX Trend. Weights are 80%/20%.

Update. Bearish sentiment closed near neutral.

Update EMA. Bearish sentiment closed at a weak Sell.
The ST VIX calls and SPXADP indicator bearish sentiment moved above the weak Sell early in the week, but closed below a weak Sell.
The ST/INT Composite indicator (outlook 1 to 3 months) is based on the Hedge Spread (48%) and includes ST Composite (12%) and three options FOMO indicators using SPX (12%), ETF (12%), and Equity (12%) calls compared to the NY ADV/DEC issues (inverted). FOMO is shown when strong call volume is combined with strong NY ADV/DEC. See Investment Diary addition for full discussion.

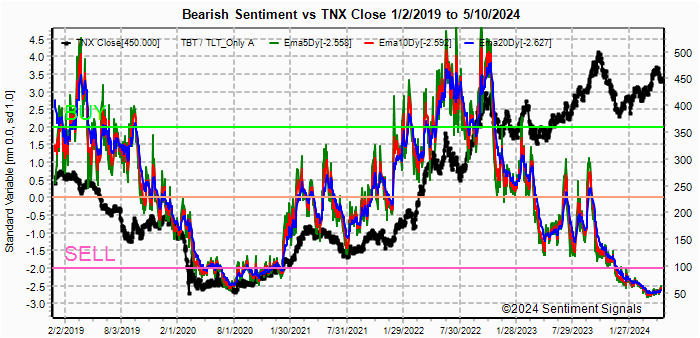
Update EMA. Bearish sentiment moved above neutral then back to a weak Sell.

Bonds (TNX)Bearish sentiment remains near recent lows. For the INT outlook with LT still negative, the gold miners (HUI) bearish sentiment is presented in a new format using the data mining software to add the inverse TNX rate to the ETF ratio.

Update. Bearish sentiment remains well above the strong Buy level.


II. Dumb Money/Smart Money Indicators

This is a new hybrid option/ETF Dumb Money/Smart Money Indicator as a INT/LT term (outlook 2-6 mns) bearish sentiment indicator. The use of ETFs increases the duration (term).

Update. Bearish sentiment reversed sharply, nearing the weak Sell VST (grn).

With the sister options Hedge Spread as a ST/INT indicator (outlook 1-3 mns), bearish sentiment spiked sharply Tue with the jump in ETF put/calls, but now has reversed back to neutral. A new composite SPX options indicator uses both the volume adj (1/B-A) and P/C equivalent spread (A-B) to compensate for the discrepancy between the two.  This replaces the old SPX options indicator for the SPX ETFs + options below and the INT/LT composite. No chart.

For the SPX, I am switching to hybrid 2X ETFs plus SPX options. Taking a look at the INT term composite (outlook 2 to 4 mns), bearish sentiment remains near neutral.

For the NDX combining the hybrid ETF options plus NDX 3X ETF sentiment with the interest rate effect,  (outlook 2 to 4 mns) bearish sentiment shows similar extremes between ETF and options as in late 2020 which resulted in a choppy market until options sentiment rose.  Note QQQ options are optimal, but are N/A and are included in ETF options.

Bearish sentiment rose with the jump in ETF put/calls.

For the SPX combining the hybrid ETF options plus SPX 2X ETF (outlook 2 to 4 mns) produces an indicator where, in this case, ETF options are a proxy for the SPY options.

Bearish sentiment for SPX moved above neutral.


III. Options Open Interest

Using Thur closing OI, remember that further out time frames are more likely to change over time, and that closing prices are more likely to be effected. Delta hedging may occur as reinforcement, negative when put support is broken or positive when call resistance is exceeded.  This week I will look out thru May 17. A text overlay is used for extreme OI to improve readability, P/C is not changed. A new addition is added for OI $ amounts with breakeven pts (BE) where call & put $ amounts cross.

With Fri close at SPX 5223, options OI for Mon is moderate and call resistance could push prices below 5200.
Wed has somewhat smaller OI where SPX has stronger put support up to 5160, likely due to CPI release.  Weakness to/below 5200 is likely, but not lower than 5150
For Fri AM strong SPX could push prices to the 5100-50 area.
For Fri PM strong SPX OI also shows a move below 5200 is likely with 5150-75 likely.
For EOM SPX OI shows strong put support in the 5050-5150 area where 5100-50 looks likely.


IV. Technical / Other

The following uses barcharts.com as a source and discusses S&P futures (ES) as a third venue of stock sentiment in addition to options and ETFs.  The non-commercial/commercial spread represents a LT bearish sentiment (dumb money/smart money) indicator. As explained in investopedia, commercial investors (red) are institutions and are smart money, while non-commercials (green) are speculators such as hedge funds and are dumb money. Here is the current  barchart graph for the S&P 500 (top) and trader positions (1st bot) with positives as net longs and negatives as net shorts.  Bearish sentiment is represented by the spread and is positive if red > green (Buy) and negative if green > red (Sell).  ES (SPX) sentiment remains below neutral at -0.25 SD, NQ (NDX) remains below neutral at -0.75 SD, YM (DJIA) remains below neutral at -0.5 SD, Dow theory no longer supports DJIA.

Click dropdown list to select from the following options:

Tech / Other History
2024

2023

2022

Other Indicators

Conclusions.  Last week was quite a surprise to the upside, but much of the economic news such as the Univ Mich confidence sentiment are showing slowing growth with higher inflation.  The Eurozone is having less of an inflation problem and may proceed to cut ST int rates even if the US does not.  The stock market is due for a slowdown, and we are likely to see that next week with still higher than desired inflation.

Weekly Trade Alert.  Some pullback is likely, but I am not expecting more than SPX 1-2% from the 5240 high to 5150-5200.  Updates @mrktsignals.

Investment DiaryIndicator Primer, Tech/Other Refs,
 update 2021.07.xx  Data Mining Indicators - Update, Summer 2021,
 update 2020.02.07 Data Mining Indicators,
 update 2019.04.27 Stock Buybacks,
 update 2018.03.28 Dumb Money/Smart Money Indicators

Article Index 2019 by Topic, completed thru EOY 2020.02.04
Article Index 2018 by Topic
Article Index 2017 by Topic
Article Index 2016 by Topic

Long term forecasts

© 2024 SentimentSignals.blogspot.com

Saturday, May 4, 2024

Riding the Range

Riding the Range

From the previous Fri close at SPX 5100, last week was expected to trade in a range of 5025 to 5125 with 5100 possible Mon/Wed/Fri and 5050 or lower possible Tue EOM.  The actual range  was SPX 5011 to 5139 with a Mon high at 5123 before a Tue drop to 5040.  Wed held around SPX 5020 before a rally to 5093 which was followed by a sharp drop into the close back to 5020 as the BOJ announced a second yen intervention.  Thur had a volatile open as a gap up was sold to SPX 5011 then rallied the rest of the day back to 5060 with AAPL EPS after close.  Both the very strong APPL results/buyback and weaker than expected jobs report blasted prices higher to SPX 5139 in early trading before a fade into the close to 5128.  With the 62% retrace just at SPX 5146 and both the following Fri SPX options OI showing the potential for a move to fill last Fri gap at 5060, the expected range for the next two weeks is SPX 5050-5150.  Weakness seems more likely the week of the 13th with PPI/CPI on 14/15th.  Current weakness in oil prices (< $80/bbl) is not likely to affect inflation until June/July releases.

INT sentiment is little changed except for the PMs (HUI) which will be discussed in more detail next week.  ST sentiment for the VIX Call & SPXADP moved to a weak Sell.  The jobs data Fri was somewhat of a surprise as was the move in TNX to 4.5%, and a continued decline in rates to 4.4% or lower would support a move in SPX to fill the gap at 5200.


I. Sentiment Indicators

The INT/LT Composite indicator (outlook 3 to 6+ months) has three separate components. Starting Aug 26, 2023 SPX options are removed due to extreme 0DTE volume distortions. New weights are ETF put-call indicator (30%), SPX 2X ETF INT ratio (40%), and 3rd a volatility indicator (30%) which combines the options volatility spread of the ST SPX (VIX) to the ST VIX (VVIX) with the UVXY $ volume.

Update Alt, INT view. Bearish sentiment rose toward neutral.

Update Alt EMA. Bearish sentiment rose toward neutral. The ST Composite as a ST (1-4 week) indicator includes the NYSE volume ratio indicator (NYDNV/NYUPV & NYDNV/NYDEC) and the UVXY $ Vol/SPX Trend. Weights are 80%/20%.

Update. Bearish sentiment fell below neutral.

Update EMA. Bearish sentiment consolidated below neutral.
The ST VIX calls and SPXADP indicator bearish sentiment continued falling, now reaching a weak Sell.
The ST/INT Composite indicator (outlook 1 to 3 months) is based on the Hedge Spread (48%) and includes ST Composite (12%) and three options FOMO indicators using SPX (12%), ETF (12%), and Equity (12%) calls compared to the NY ADV/DEC issues (inverted). FOMO is shown when strong call volume is combined with strong NY ADV/DEC. See Investment Diary addition for full discussion.

Update EMA. Bearish sentiment continued to decline to just above a weak Sell.

Bonds (TNX)Bearish sentiment is little changed. For the INT outlook with LT turning positive, the gold miners (HUI) bearish sentiment is presented in a new format using the data mining software to add the inverse TNX rate to the ETF ratio.

Update. Bearish sentiment soared to a strong Buy with strong volume in the Dust inverse ETF.  This may be similar to mid-2018, a year & a half before the pandemic.  Next week will extend chart back and discuss possibilities.


II. Dumb Money/Smart Money Indicators

This is a new hybrid option/ETF Dumb Money/Smart Money Indicator as a INT/LT term (outlook 2-6 mns) bearish sentiment indicator. The use of ETFs increases the duration (term).

Update. Bearish sentiment rose slightly above neutral.

With the sister options Hedge Spread as a ST/INT indicator (outlook 1-3 mns), bearish sentiment declined slightly to below neutral. A new composite SPX options indicator uses both the volume adj (1/B-A) and P/C equivalent spread (A-B) to compensate for the discrepancy between the two.  This replaces the old SPX options indicator for the SPX ETFs + options below and the INT/LT composite. No chart.

For the SPX, I am switching to hybrid 2X ETFs plus SPX options. Taking a look at the INT term composite (outlook 2 to 4 mns), bearish sentiment continued to rise, esp in SPX options.

For the NDX combining the hybrid ETF options plus NDX 3X ETF sentiment with the interest rate effect,  (outlook 2 to 4 mns) bearish sentiment shows similar extremes between ETF and options as in late 2020 which resulted in a choppy market until options sentiment rose.  Note QQQ options are optimal, but are N/A and are included in ETF options.

Bearish sentiment remains near the weak Sell level.

For the SPX combining the hybrid ETF options plus SPX 2X ETF (outlook 2 to 4 mns) produces an indicator where, in this case, ETF options are a proxy for the SPY options.

Bearish sentiment for SPX is less bearish than for NDX.


III. Options Open Interest

Using Thur closing OI, remember that further out time frames are more likely to change over time, and that closing prices are more likely to be effected. Delta hedging may occur as reinforcement, negative when put support is broken or positive when call resistance is exceeded.  This week I will look out thru May 10. A text overlay is used for extreme OI to improve readability, P/C is not changed. A new addition is added for OI $ amounts with breakeven pts (BE) where call & put $ amounts cross.

With Fri close at SPX 5128, options OI for Mon is moderate with strong put support at 5030 and little call resistance until 5190.  Prices could go either way.
Wed has very small OI where SPX has put support starting at 5050 and increasing call resistance up to 5190.
For Fri very strong SPX OI put support in the 4800-900 area shows strong expectation of the "Sell in May" to 4800s, but ITM puts may keep prices near 5100.
For Fri mn exp SPX OI has little put support until 5050 and call resistance down to 5070 .

IV. Technical / Other

The following uses barcharts.com as a source and discusses S&P futures (ES) as a third venue of stock sentiment in addition to options and ETFs.  The non-commercial/commercial spread represents a LT bearish sentiment (dumb money/smart money) indicator. As explained in investopedia, commercial investors (red) are institutions and are smart money, while non-commercials (green) are speculators such as hedge funds and are dumb money. Here is the current  barchart graph for the S&P 500 (top) and trader positions (1st bot) with positives as net longs and negatives as net shorts.  Bearish sentiment is represented by the spread and is positive if red > green (Buy) and negative if green > red (Sell).  ES (SPX) sentiment remains below neutral at -0.75 SD, NQ (NDX) remains below neutral at -0.75 SD, YM (DJIA) remains below neutral at -0.5 SD, Dow theory no longer supports DJIA.

Click dropdown list to select from the following options:

Tech / Other History
2024

2023

2022

Other Indicators

Conclusions.  More of a trading range with a possible positive bias is expected until late May.

Weekly Trade Alert.  This week could be a consolidation week between SPX 5100-50 unless good/bad surprises come from ME.  Updates @mrktsignals.

Investment DiaryIndicator Primer, Tech/Other Refs,
 update 2021.07.xx  Data Mining Indicators - Update, Summer 2021,
 update 2020.02.07 Data Mining Indicators,
 update 2019.04.27 Stock Buybacks,
 update 2018.03.28 Dumb Money/Smart Money Indicators

Article Index 2019 by Topic, completed thru EOY 2020.02.04
Article Index 2018 by Topic
Article Index 2017 by Topic
Article Index 2016 by Topic

Long term forecasts

© 2024 SentimentSignals.blogspot.com