My biggest mistake last week was expecting AAPL earnings to effect Thurs SPX price levels since it occurred after hours and combined with AMZN sent tech stocks soaring Fri. Once the huge SPX call resistance at 4100 was exceeded, delta hedging kicked in forcing the option writers to buy SPX futures to hedge their losses and the result pushed the SPX to 4140, well above my target range of 3925 to 4075.
ST indicators (ST Composite and VIX calls in Tech/Other) are now on official Sells for the next two to four weeks, but the NDX ETF indicator remains on a Buy. The most likely outcome is a ST top next week with a decline beginning with stronger than expected job/wage gains on Fri continuing through the mid month CPI/PPI inflation data that is likely to remain "sticky" as oil continues to hover around $100/bbl. The decline is expected to be only to the low-mid 3900s. With the next FOMC mid-Sept, this may provide an INT higher top with a final rally for the NDX.
The Tech/Other section looks at a recession indicator developed by the Chicago Fed that has shown an 86% accuracy level based on the input of 500 variables.
I. Sentiment Indicators
The INT/LT Composite indicator (outlook 3 to 6+ months) has three separate components. 1st is the SPX and ETF put-call indicators (30%), 2nd the SPX 2X ETF INT ratio (40%), and 3rd a volatility indicator (30%) which combines the options volatility ratio of the ST SPX (VIX) to the ST VIX (VVIX) with the UVXY $ volume.
Update Alt. In this case the wts for the SPX 2X ETF ratio (SDS/SSO) and SPX puts & calls spread are adj to equal as in the DM/SM section for SPX ETFs. Volatility measures were little changed just below a Buy, while a sharp decrease in SPX ETF sentiment was partially offset by rising options sentiment. Overall, bearish sentiment dropped to below neutral, nearing the level of the SPX June top.


Update A sharp decline in sentiment has reached the Sell level of excess bullishness.

Update EMA. Sentiment remains similar to the June SPX highs.

Update EMA. Hedging continues to provide some support, but a ST pullback is likely.


Update. Strength in bearish sentiment helped reverse the fall below the important 200 level as the HUI rallied about 3% last week and rising sentiment should contribute to some follow thru.

II. Dumb Money/Smart Money Indicators
This is a new hybrid option/ETF Dumb Money/Smart Money Indicator as a INT/LT term (outlook 2-6 mns) bearish sentiment indicator. The use of ETFs increases the duration (term).
Update. This indicator is usually early at predicting tops as seen in mid-2018 and 2021 and early 2020, but is a strong indicator that the current rally is only a bear market rally, so the question is when, not if, the decline continues.


III. Options Open Interest
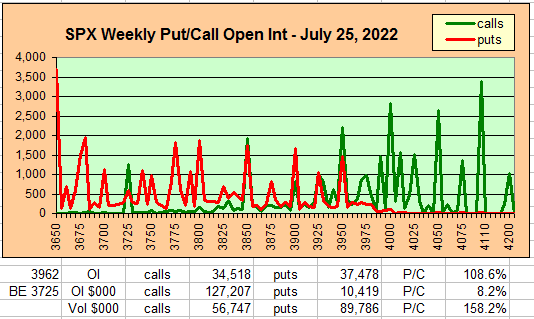
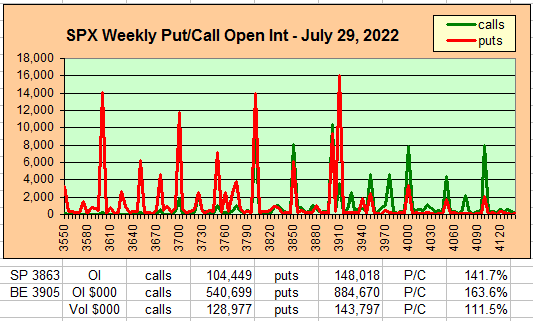
Using Thur closing OI, remember that further out time frames are more likely to change over time, and that closing prices are more likely to be effected. Delta hedging may occur as reinforcement, negative when put support is broken or positive when call resistance is exceeded. This week I will look out thru Aug 5. A text overlay is used for extreme OI to improve readability, P/C is not changed. Also, this week includes a look at the GDX for Dec exp. A new addition is added for OI $ amounts with breakeven pts (BE) where call & put $ amounts cross.
With Fri close at SPX 4130, options OI for Mon is very small with possible support at 4100 due to delta hedging and call resistance at 4150.


For optn exp Fri shows a setup consistent for my 2-4 week SPX outlook where there is strong resistance at 4200 with the potential to drop down to the 4000-50 level or lower and strong support t at 3900.

IV. Technical / Other
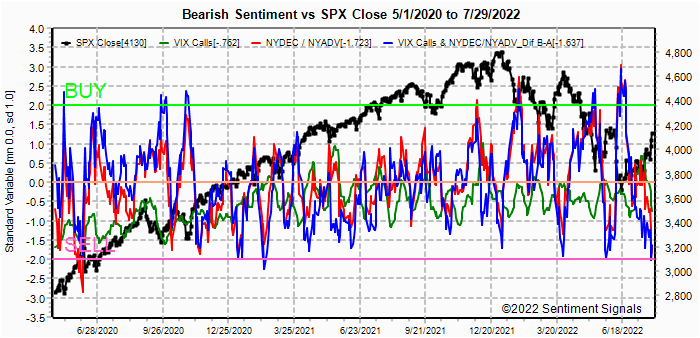
First, a look at the VIX Call indicator has now moved to a full Sell for the next 2 to 4 weeks, although not as strong as the Buy at the June SPX lows. Only a partial retracement of the current rally is expected.
Next, a look at possibly the most accurate model for predicting recessions since the 1960s. The BBK Index developed by the Chicago Fed has been shown to be 86% accurate at predicting recessions and uses 500 variables for inputs. Other than early 2020, it stands at the lowest level since 1980 and is a strong indication that a serious recession is ahead.

Conclusions. Last week proved to be somewhat stronger than expected with the pop over SPX 4100, although upside momentum was expected to carry thru early Aug. ST indicators show that a downturn is expected on schedule and may start by EOW. Fri unemployment and wage data may provide the initial catalyst for the decline in bonds and stocks if continued economic strength supports a more hawkish Fed. EW analysts are calling this a 4th wave rally with Trader Joe having a target of 4200-400 and Pretzel Logic a similar target at 4371 the 62% retracement level, but a pullback is likely ST before a top in Sept-Oct.
Weekly Trade Alert. The expected trading range should probably be extended to SPX 3950-4150. Mon-Wed may be consolidation days, while downside risk increases late Thur thru the inflation reports mid-month that are likely to dampen the "Goldilocks" economic outlook. Updates @mrktsignals.
Investment Diary, Indicator Primer, Tech/Other Refs,
update 2021.07.xx Data Mining Indicators - Update, Summer 2021,
update 2020.02.07 Data Mining Indicators,
update 2019.04.27 Stock Buybacks,
update 2018.03.28 Dumb Money/Smart Money Indicators
Article Index 2019 by Topic, completed thru EOY 2020.02.04
Article Index 2018 by Topic
Article Index 2017 by Topic
Article Index 2016 by Topic
Long term forecasts
© 2022 SentimentSignals.blogspot.com