
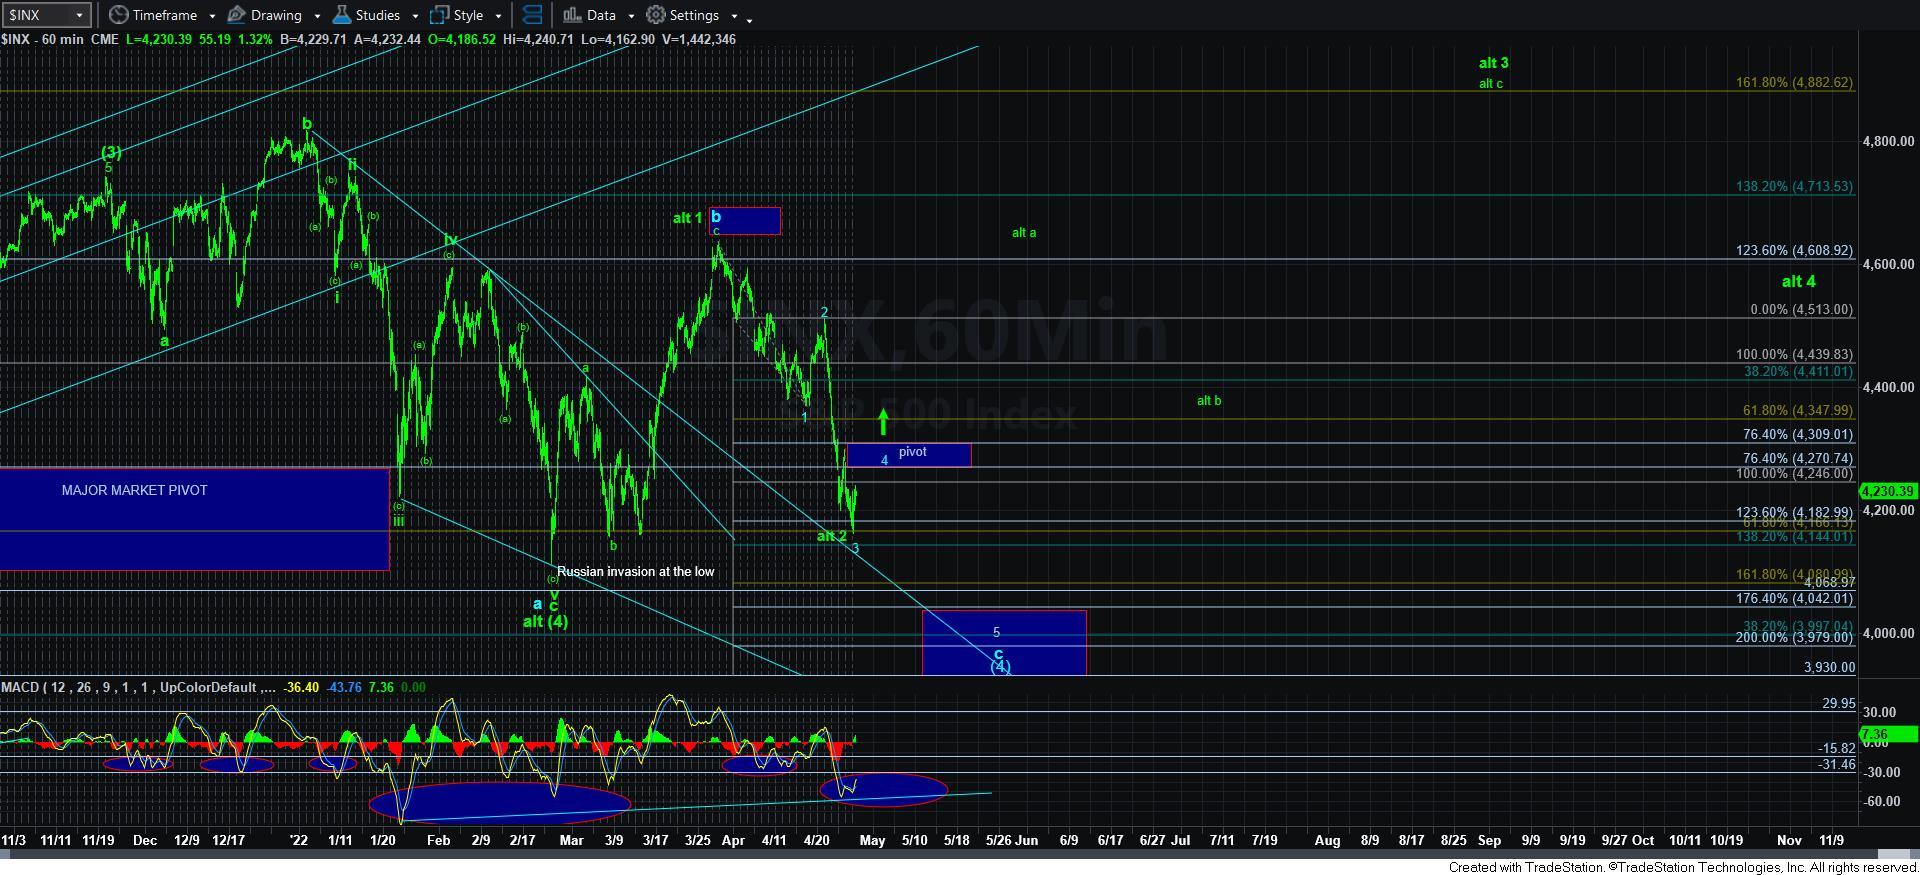
Last week started out much as expected with a strong rally in SPX, but from a lower low of 4201 to a high of 4300, before a washout on Tue to a close at 4175. From a low Wed AM around 4160, the SPX rallied almost 150 pts to 4300+ Thur, but a weak EPS surprise from AMZN led to another washout Fri into the close to the 4120s or a full retest of the Feb lows. Looking forward, the next major Bradley turn date is May 14 (close to the mid-May low discussed last week). The last major Bradley turn date was Mar 28, one day before the high at SPX 4640, so May 14 (a Saturday) should be a low +/- a day or two.
Avi shows a possible EW count in his Wed update where we may be seeing a large ABC decline with the A being an SPX 700 pt drop from the Jan 4820 high to 4115 in Feb, B a 500+ pt rally to the Mar high at 4640, and C a 5 wave drop of 700 pts to about 3940 where each decline is 400 pts, the w3 from 4512. Next should be a 200+ pt rally to 4300+ before the final wave down into the mid-late May time frame.
Sentiment wise, LT sentiment remains well below that seen at the Feb lows meaning more downside is likely, while ST sentiment is near the Buy level where many ST rallies have occurred in the past, while ST/INT sentiment is high relative to the post-Covid period where the Fed has been "all-in", but still somewhat low relative to the pre-Covid period of a normal Fed and may mean more trouble ahead.
I. Sentiment Indicators
The INT/LT Composite indicator (outlook 3 to 6+ months) has three separate components. 1st is the SPX and ETF put-call indicators (30%), 2nd the SPX 2X ETF INT ratio (40%), and 3rd a volatility indicator (30%) which combines the options volatility ratio of the ST SPX (VIX) to the ST VIX (VVIX) with the UVXY $ volume.
Update. Sentoment remains well below that seen at the Feb lows and could mean significantly lower lows if B as a flat aka Oct-Nov 2018, or more retest/lows as Feb-May 2018.

The ST Composite as a ST (1-4 week) indicator includes the NYSE volume ratio indicator (NYDNV/NYUPV & NYDNV/NYDEC) and the UVXY $ Vol/SPX Trend. Weights are 80%/20%.
Update. Sentiment near a Buy, could mean a ST rally or more downside before bigger rally.

Update. Sentiment is boosted by very high Hedge Spread that may be ST bullish, but looking at LT EMAs could be effect of sentiment shifting to pre-Covid period of normal Fed.

Update EMAs. Sentiment may be ST bullish.

Update EMA LT. There is a very noticable shift in hedging pre (2018-19) and post (2020-21) Covid, most likely due to super accommodative Fed, and higher sentiment to generate Buys and Sells is likely.


Update. Sentiment remains at the Sell level with little change given the 15% drop in prices, somewhat reminds me of sentiment for the NDX which remained near lows at the end of Feb.

II. Dumb Money/Smart Money Indicators
This is a new hybrid option/ETF Dumb Money/Smart Money Indicator as a INT/LT term (outlook 2-6 mns) bearish sentiment indicator. The use of ETFs increases the duration (term).
Update. Sentiment is high by historical comparison, but still well below that of the Feb lows and is most similar to Nov 2018 where Dec lows produced equal sentiment levels before an INT bottom.


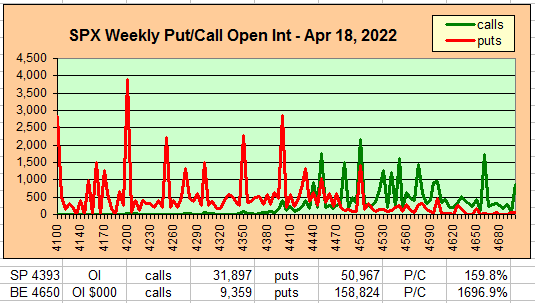
III. Options Open Interest
Using Thur closing OI, remember that further out time frames are more likely to change over time, and that closing prices are more likely to be effected. Delta hedging may occur as reinforcement, negative when put support is broken or positive when call resistance is exceeded. This week I will look out thru May 6. A new addition is added for OI $ amounts with breakeven pts (BE) where call & put $ amounts crossand $ volume. A special Tue option OI is added and may mean unusual volatility.
With Fri close at SPX 4132, options OI for Mon has moderate put support at 4100 and 4125 and weak support up to 4190. Some support at current levels but little upside bias may mean a tight trading range.


IV. Technical / Other - N/A
Conclusions. ST sentiment indicates that a moderate SPX rally of 200+ pts can occur, but INT/LT sentiment indicate that an INT bottom is not likely (ATH). The most likely INT outlooks seem to be a continued decline of 5 waves (EW) to SPX 4000 or lower, but a wider trading range (4100-4600) remains a possibility into the mid-term election. The May 14 major Bradley turn date should provide an INT/swing low +/- a couple days.
Weekly Trade Alert. Next week should have an upside bias and may reach the SPX 4300 level or higher. The Tue SPX OI could indicate unusual volatility, probably to the upside. Updates @mrktsignals.
Investment Diary, Indicator Primer, Tech/Other Refs,
update 2021.07.xx Data Mining Indicators - Update, Summer 2021,
update 2020.02.07 Data Mining Indicators,
update 2019.04.27 Stock Buybacks,
update 2018.03.28 Dumb Money/Smart Money Indicators
Article Index 2019 by Topic, completed thru EOY 2020.02.04
Article Index 2018 by Topic
Article Index 2017 by Topic
Article Index 2016 by Topic
Long term forecasts
© 2022 SentimentSignals.blogspot.com


