
Last week I raised the opinion that bonds may be facing a situation of "sell the rumor, buy the news" regarding the Fed's QT expected for the May 4 FOMC, and in fact both Mon and Thur saw stong rises in int rates with the TNX reaching 2.8%. The rise in rates over powered the modestly positive sentiment. The SPX was contained in a smaller range of 100 pts only downward from about 4390-4490. I continue to feel that a 3% TNX is likely to cause the SPX to fall to 4300-4350, while a larger increase to 3.4-3.5% may result in SPX 4000 or lower (with 3700-800 possible). Trying to rationalize the current rise in rates, I remembered a trend seen in the QE programs of 2010-20 where rates fell before the QE started and rose after. The reason was front-running by fin institutions (banks & insc cos) who bought govt bonds at lower prices before QE then sold to the Fed at higher prices after rates fell. Now may be a similar front-running only selling before the Fed, expecting to buy back at lower prices when the Fed sells bonds.
From a longer-term perspective, bonds have now crossed the Rubicon by
breaking out of a long-term channel going back to the 1980s with a view from the
early 1990s below. What is noticeable is that the recent sharp rise was
only seen twice in 1993-4 and 1999-2000.

I. Sentiment Indicators
The INT/LT Composite indicator (outlook 3 to 6+ months) has three separate components. 1st is the SPX and ETF put-call indicators (30%), 2nd the SPX 2X ETF INT ratio (40%), and 3rd a volatility indicator (30%) which combines the options volatility ratio of the ST SPX (VIX) to the ST VIX (VVIX) with the UVXY $ volume.
Update. INT/LT sentiment remains relatively unchanged with last weeks drop to SPX 4400

Update. ST sentiment surprisingly fell back to neutral with last weeks decline.

UVXY $ Vol only. Sentiment seems to be rising in a choppy pattern that may mean a spike upward similar to July-Aug 2021 is near, meaning a price breakdown for SPX.

Update VST ema. A spike lower in sentiment earlier in the week has now moved to neutral.

Update. ST/INT sentiment remains modestly positive, consistent with the choppy up trends in the SPX from July-Oct 2021 and Dec 2021 thu Jan 2022.

Update ema. ST sentiment surprising fell late in the week that could lead to continued weakness ST.


Update. Weak bearish sentiment continues to have little effect with the strong inflation outlook.

II. Dumb Money/Smart Money Indicators
This is a new hybrid option/ETF Dumb Money/Smart Money Indicator as a INT/LT term (outlook 2-6 mns) bearish sentiment indicator. The use of ETFs increases the duration (term).
Update. INT/LT sentiment has returned to mildly positive.


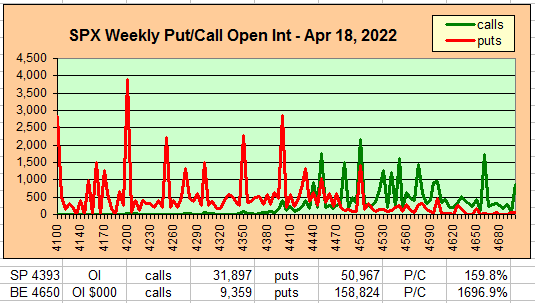
III. Options Open Interest
Using Thur closing OI, remember that further out time frames are more likely to change over time, and that closing prices are more likely to be effected. Delta hedging may occur as reinforcement, negative when put support is broken or positive when call resistance is exceeded. This week I will look out thru Apr 22 and EOM. A text overlay is used for extreme OI to improve readability, P/C is not changed. Also, this week includes a look at the GDX and TLT for May exp. A new addition is added for OI $ amounts with breakeven pts (BE) where call & put $ amounts cross.
With Fri close at SPX 4393, options OI for Mon is small, but shows moderate support at SPX 4400 and 4350, then strong support at 4200. Price range could be 4400-4450. A notable difference compared to the last few weeks are few calls below 4400 that should reduce selling pressure as shown by the high BE.


For Apr EOM strong OI shows strong put support around SPX 4300 and at 4400 making these likely inflection pts with some upward bias to 4500+ and call resistance at 4500 and 4550.

Using the GDX as a gold miner proxy closing at 40.9, there should be some downward pressure due to low OI P/C and $ BE, but high inflation numbers add support. (Date is May 20).

Currently the TLT is 120.8 with the TNX at 2.83%, There may be some support from the calls at 120 and if "front-running" the Fed is a strong source of selling, a reversal to 125 or higher is likely after May 4. (Date is May 20).

IV. Technical / Other - N/A
Conclusions. As noted over the last several weeks after the late Mar high at SPX 4600+, int rates were likely to be a dominant factor with an expected decline to SPX 4300-50 before a continuation of the rally. The sharpness of the rise was unexpected and will probably continue into early May. If rates (TNX) stop at 3% then SPX 4300-50 may be the low as sentiment (particularly SPX & NDX) are becoming more supportive, but a move of TNX over 3%, especially near 3.5%, increases the possibility of a washout to SPX 4000 or lower (possibly 3700-800). Since I expect int rates to continue to rise into the May 4 FOMC, expect more volatility, lower prices into early May, especially in the NDX.
Weekly Trade Alert. ST/INT sentiment is only mildly positive so a period rangebound volatility is likely between SPX 4400-500 if rates stabilize and 4300-4400 if rates rise mildly. Updates @mrktsignals.
Investment Diary, Indicator Primer, Tech/Other Refs,
update 2021.07.xx Data Mining Indicators - Update, Summer 2021,
update 2020.02.07 Data Mining Indicators,
update 2019.04.27 Stock Buybacks,
update 2018.03.28 Dumb Money/Smart Money Indicators
Article Index 2019 by Topic, completed thru EOY 2020.02.04
Article Index 2018 by Topic
Article Index 2017 by Topic
Article Index 2016 by Topic
Long term forecasts
© 2022 SentimentSignals.blogspot.com
No comments:
Post a Comment