I forgot about this Xmas being on Sat, so here is a special Friday edition as a Xmas present. I also left out the trading range parameters last week, but hopefully everyone knew it was SPX 4500-4750+.
Last weeks outlook was that the decline into the opt exp Fri was not the beginning of a downtrend and compared to 2015 could see new highs over the next couple of weeks. Indeed, the next three days after Mon's follow thru to an SPX 4531 low was followed by a three day bonanza to a new closing high at 4726, missing the intra-day high by 4 pts. Now, however, I am seeing the same analysts who were predicting an SPX drop to the 4300's last weekend predicting a move to 4900-5000 over the next couple of weeks. So don't be surprised if we see a drop below SPX 4531 early Jan, before a move to 4750 or higher later in the month.
Overall ST/INT sentiment is near neutral and next week is likely to be a consolidation week between SPX 4675 and 4725.
I. Sentiment Indicators
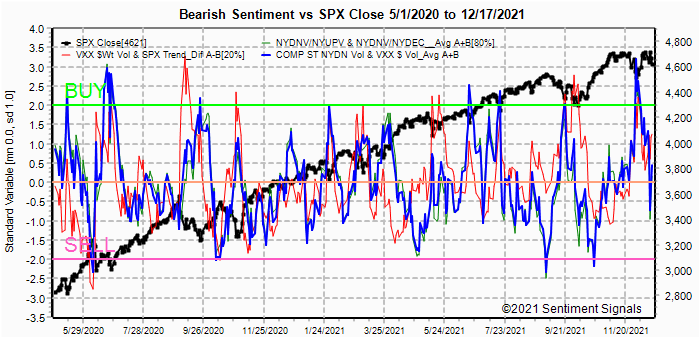
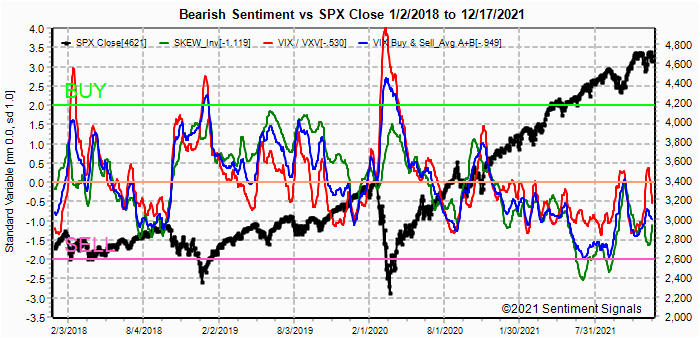
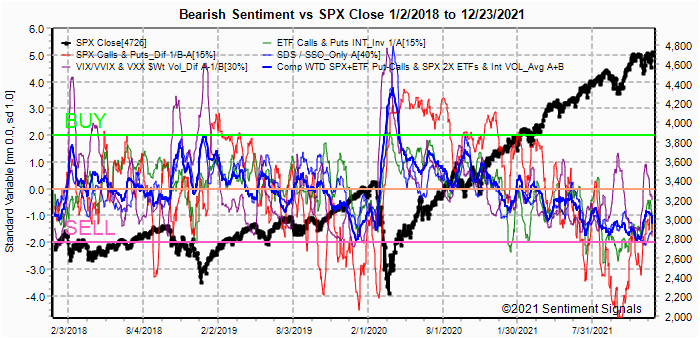
The INT/LT Composite indicator (outlook 3 to 6+ months) has three separate components. 1st is the SPX and ETF put-call indicators (30%), 2nd the SPX 2X ETF INT ratio (40%), and 3rd a volatility indicator (30%) which combines the options volatility ratio of the ST SPX (VIX) to the ST VIX (VVIX) with the VXX $ volume.
The INT/LT Composite appears to have completed its rally matching the Jan 2020 decline and we may not see a lower low before the final top.
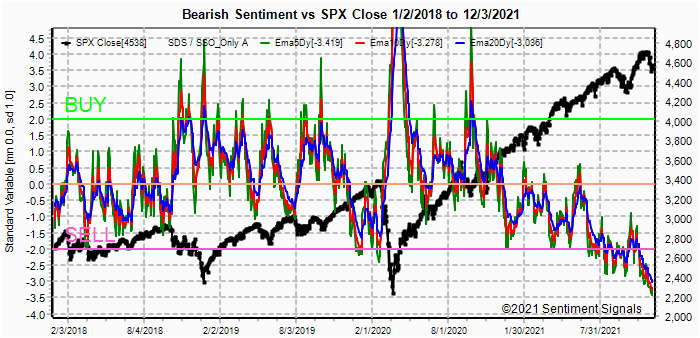
Last weeks SPX surge moved the 10 day SMAs to neutral with several more days of consolidation in the 4700+ range likely before any pullback.

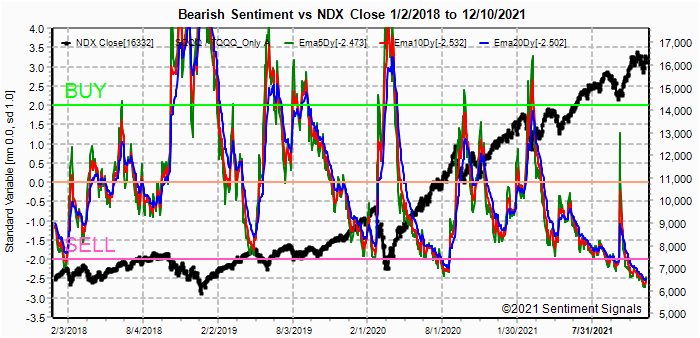
The ST/INT Composite may be following the pattern of Sept-Oct 2020 where a decline in the LT EMA (blue) to -0.5 to -1.0 is needed before a retest of the Dec lows.
The faster moving EMAs are more reflective of a fast moving market and show that sentiment may reach the Oct 2020 levels in a few days.


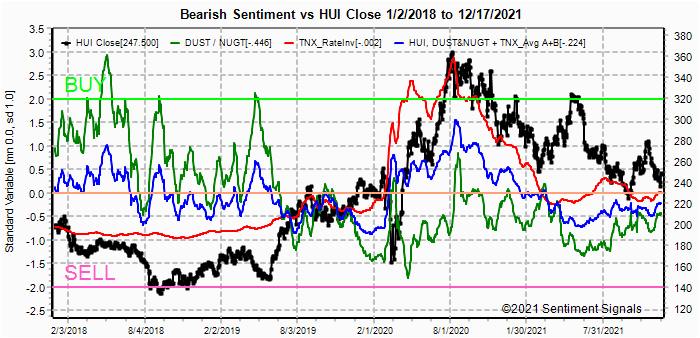
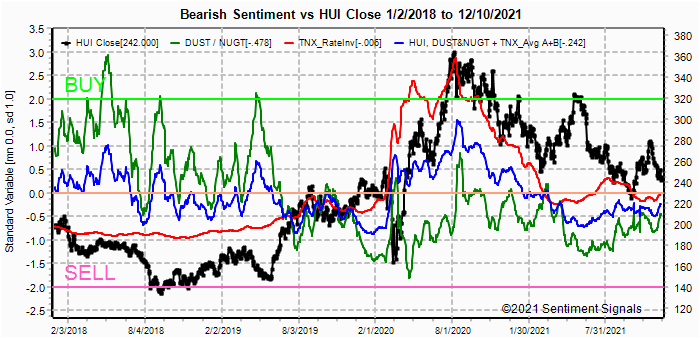
A downturn in bearish sentiment may limit rallies to the 260 resistance level.

II. Dumb Money/Smart Money Indicators
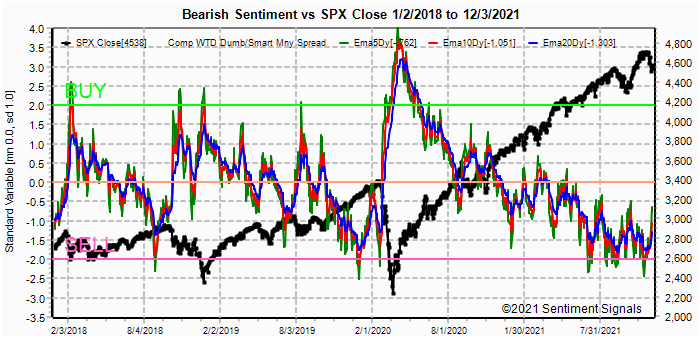
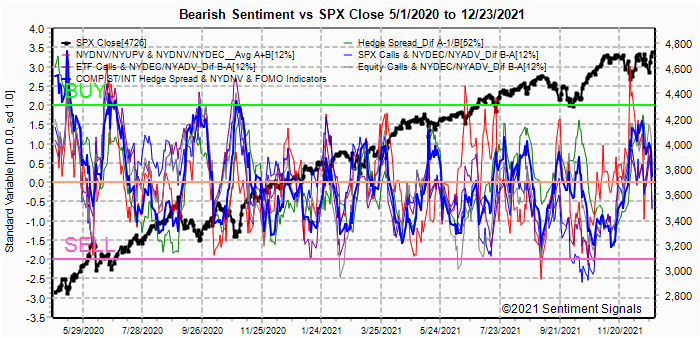
This is a new hybrid option/ETF Dumb Money/Smart Money Indicator as a INT/LT term (outlook 2-6 mns) bearish sentiment indicator. The use of ETFs increases the duration (term).
Here, the faster moving EMAs were used to reflect the fast moving prices and we see that bearish sentiment peaked near the same level as the Jan 2020 pullback and has reversed sharply.


III. Options Open Interest
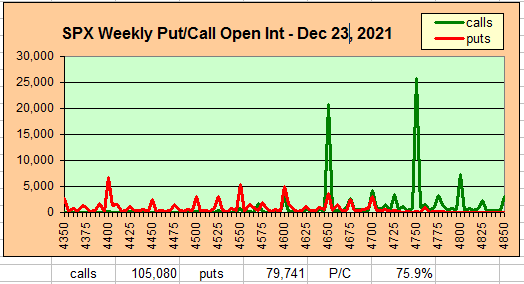
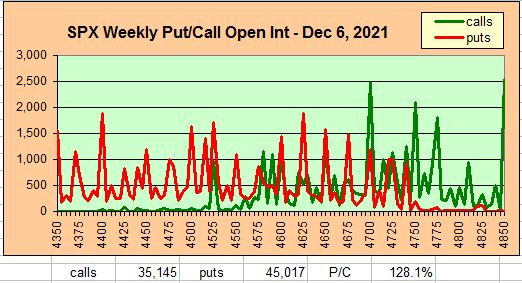
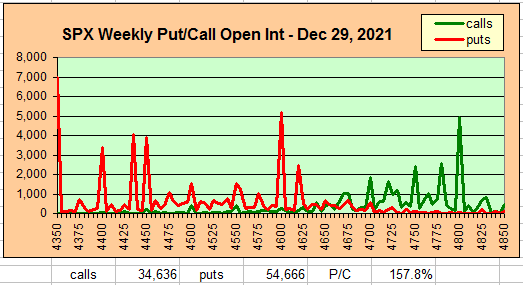
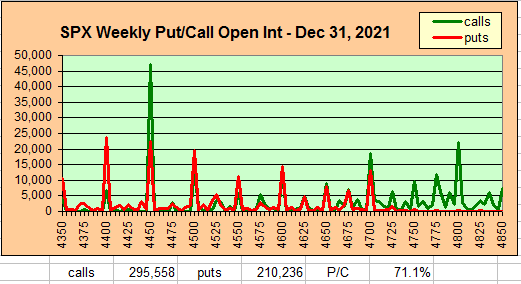
Using Thur closing OI, remember that further out time frames are more likely to change over time, and that closing prices are more likely to be effected. Delta hedging may occur as reinforcement, negative when put support is broken or positive when call resistance is exceeded. This week I will look out thru Dec 30.
With Fri close at SPX 4726, options OI for Mon is small, but the overall P/C is high. Most of the put support is far OTM with 4700 a hedge with +400 puts. Some negative bias toward 4700 is possible with call resistance at 4750.

IV. Technical / Other N/A
Conclusions. The SPX goes down 200 pts and everyone thinks it will go down another 200 pts, then we go up 200 pts and everyone thinks it will go up another 200 pts. At some point there will be a breakout / breakdown, but possibly not until everyone thinks otherwise.
Weekly Trade Alert. With ST sentiment near neutral the outlook for next week is for a consolidation near recent highs. If we continue to see a sharp decline in bearish sentiment, the there may be another shape decline to test recent lows before a final rally in Jan to INT highs. Another possibility remains an ED in the SPX stretching over the next two to three weeks. Updates @mrktsignals.
Investment Diary, Indicator Primer,
update 2021.07.xx Data Mining Indicators - Update, Summer 2021 (in progress),
update 2020.02.07 Data Mining Indicators,
update 2019.04.27 Stock Buybacks,
update 2018.03.28 Dumb Money/Smart Money Indicators
Article Index 2019 by Topic, completed thru EOY 2020.02.04
Article Index 2018 by Topic
Article Index 2017 by Topic
Article Index 2016 by Topic
Long term forecasts
© 2021 SentimentSignals.blogspot.com