
Last week was expected to start strong with a snapback rally to about the SPX 4625 level due to high ST bearish sentiment (about a 50% retrace), but Tue strength in the EU on the weakness of Omicron symptoms spilled over into US markets resulting in a 4% rally in two days. The rest of the week was only mildly bullish. ST SPX options OI indicates more upside is likely next week, but may fizzle by Fri optn exp. INT high bearish sentiment is little changed, leaving the door open to higher prices ahead or at least a few weeks of high level consolidation before a top is formed.
I. Sentiment Indicators
The INT/LT Composite indicator (outlook 3 to 6+ months) has three separate components. 1st is the SPX and ETF put-call indicators (30%), 2nd the SPX 2X ETF INT ratio (40%), and 3rd a volatility indicator (30%) which combines the options volatility ratio of the ST SPX (VIX) to the ST VIX (VVIX) with the VXX $ volume.
A modest increase in bearish INT/LT sentiment opens the possibility to a Feb 2020 type rally to new highs before a larger decline.

The ST Composite as a ST (1-4 week) indicator includes the NYSE volume ratio indicator (NYDNV/NYUPV & NYDNV/NYDEC) and the VXX $ Vol/SPX Trend. Weights are 80%/20%.
ST bearish sentiment has backed off the recent extreme highs, but remains elevated, and could support a modest advance.

ST/INT bearish sentiment remains high.

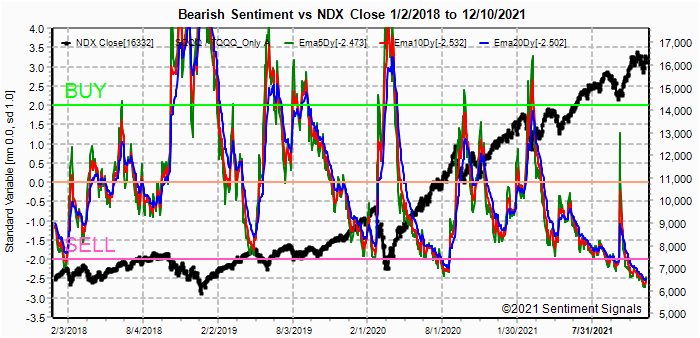
The faster moving EMAs showed support for a very ST strong advance last week, but LT sentiment does not support a continued LT strong advance.


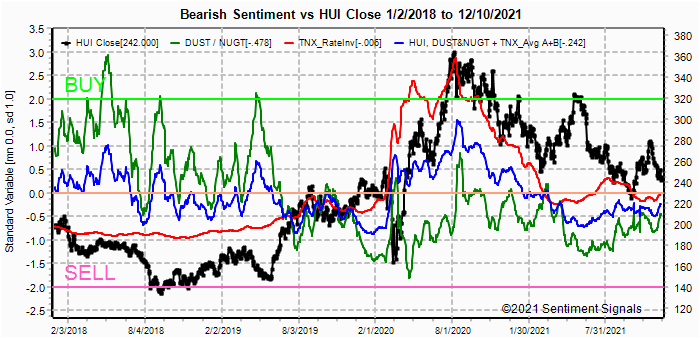
An increase in bearish sentiment as the HUI approaches the bottom of the 240-60 trading range may mean a ST rally is close.
II. Dumb Money/Smart Money Indicators
This is a new hybrid option/ETF Dumb Money/Smart Money Indicator as a INT/LT term (outlook 2-6 mns) bearish sentiment indicator. The use of ETFs increases the duration (term).
An increase in bearish sentiment could support a modest rally to ATHs as seen in Feb 2020.


III. Options Open Interest
Using Thur closing OI, remember that further out time frames are more likely to change over time, and that closing prices are more likely to be effected. Delta hedging may occur as reinforcement, negative when put support is broken or positive when call resistance is exceeded. This week I will look out thru Dec 18.
With Fri close at SPX 4712, options OI for Mon is very small, but the overall P/C is high with put support at 4675 and call resistance at 4700 and 4750. Small positive bias as long as 4700 holds due to delta hedging,


IV. Technical / Other
N/A
Conclusions. With the Nov decline pushing the VIX well over 30 it is likely that a period of cooling down is seen before any further declines and is much of the reason for my pushing a possible turn date to mid-Jan. The rally of last week looks much like a distribution setup for next weeks optn exp for Mn/Qtr, but there are little signs of a ST top of any importance.
There is
a lot of talk about the Fed becoming more hawkish due to the persistently high
inflation, but it is unlikely any changes will be enacted until Jan 2022.
Weekly Trade Alert. Limited gains are likely, but a breakout over
SPX 4750 is not. Updates @mrktsignals.
Investment Diary,
Indicator Primer,
update 2021.07.xx
Data Mining Indicators - Update, Summer 2021 (in progress),
update 2020.02.07 Data Mining Indicators,
update 2019.04.27 Stock Buybacks,
update 2018.03.28 Dumb Money/Smart Money Indicators
Article Index 2019 by Topic, completed thru EOY 2020.02.04
Article Index 2018 by Topic
Article Index 2017 by Topic
Article Index 2016 by Topic
Long term forecasts
© 2021 SentimentSignals.blogspot.com
No comments:
Post a Comment