Saturday, January 25, 2020

Evidence of a Four Year Cycle

Last Friday's selloff was eerily similar to the late Jan 2018 EOM decline which also started with an SPX 50 pt drop.  This plus a sell signal from the INT volume indicator NYUPV /NYDNV (see Tech/Other) last week leads me to believe that a top may be (nearly) in about a week earlier than expected.  However, with all indicators not on board we may only start with a 4% decline to the SPX 100 SMA around 3200 then a retest of the ATH before a larger decline as in Jun-Jul 2015.

The wildcard, however, is the corona virus breakout in China.  In Oct 2014, fears of an avian flu breakout in the USA resulted in a 10% SPX decline in two weeks.  This outbreak poses a much larger potential threat.  As simulated by a John Hopkins researcher several months ago, a full blown pandemic could result in worldwide deaths of 65 million people over 18 months resulting in a 11% drop in GDP and 20-40% drop in stock markets.

This fits nicely with the LT view of the Safety Trade indicator (see Mon/Twitter, below) which last week I thought was supportive of higher prices, but when looking back over the 2013-2016 period compared to 2017-20 there is evidence of a four year cycle where the late 2018 indicator high only matches the Aug 2015 high and a higher high matching Feb 2016 is needed.  This implies an even larger stock market decline than 2018 and lower int rates with the TNX possibly reaching 1%.


I. Sentiment Indicators

The overall Indicator Scoreboard (INT term, outlook two to four months) bearish sentiment has ticked up only slightly.


The INT view of the Short Term Indicator (VXX $ volume and Smart Beta P/C [ETF Puts/Equity Calls], outlook two to four months) bearish sentiment has only budged, warning of a significant pickup in volatility ahead.


The next three charts are LT from 2014 using 5X EMAs to show possible 4 tear cycle.  Bonds (TNX).  Interest rates have now broken below the rising trend and seem to be following the pattern of mid-2016.


For the INT outlook with LT still negative, the gold miners (HUI) bearish sentiment continues to fall as prices are also rising similar to mid-2016.


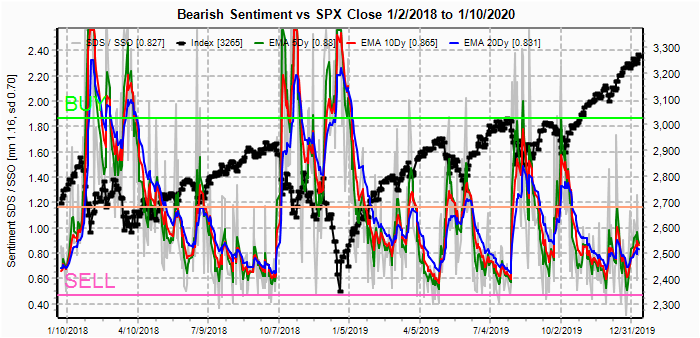
Finally, the Safety Trade Indicator (SPX/TNX ETFs) from a LT perspective the rise in sentiment during the Oct-Dec 2018 selloff was actually fairly mild and compares to the Aug 2015 rise.  This indicates that a lower retest of the SPX lows of 2018 may be required.


II. Dumb Money/Smart Money Indicators

The option-based Dumb Money/Smart Money Indicator as short/INT term (outlook 2 to 4 mns/weeks) has bounced off recent lows, but is not supportive of a rally.


And the sister options Hedge Ratio sentiment has barely moved, indicating a significant increase in hedging is required to support a rally.

The INT term SPX Long Term (2x/DM) ETFs (outlook two to four weeks) bearish sentiment has been forming a rounded bottom and is about the same as the Jan 2018 top.


The INT term NDX Long Term (2x/DM) ETFs (outlook two to four weeks) bearish sentiment is much like the SPX 2X ETFs and seems to have failed just above the target of 9200-50 at 9272.


III. Options Open Interest

Using Thur closing OI, remember that further out time frames are more likely to change over time, and that closing prices are more likely to be effected.  Fri large decline has likely increased put support considerably.  Delta hedging may occur as negative reinforcement when put support is broken or call resistance is exceeded.  This week I will look out thru Jan 31. Also, this week includes a look at the GDX for Feb exp.

With Fri close at SPX 3295, options OI for Mon shows little put support until 3250.  The large call OI 3350-70 is probably a bet on a "no" for impeachment by the Senate.


Wed has small OI where SPX already shows moderate put support from 3250-80 as the Mon expected rally was supposed to reverse sharply.


For Fri EOM, large OI shows put support starting at SPX 3275 and call resistance at 3300 with an expected range of 3275-3300.


Using the GDX as a gold miner proxy closing at 29.22,.but faces strong resistance at 30 and 32 with put support ar 27.  A move over 30 could accelerate with delta hedging.


Currently the TLT is 142 with the TNX at 1.68% as weak stocks increased demand for bonds.

IV. Technical / Other

Fur several years, I have been watching the  $NYUPV/$NYDNV as an INT/LT indicator using the 100 and 200 day SMAs.  There seems to be an emerging cycle where a decline in the 100 SMA tends to cross below 1.40 prior to INT tops (red circles) as well as mid-rally corrections (green circles) so far they have been alternating since 2015 with a cross last week that should be an INT top.


Looking more closely at both the 2015 and 2018 top showed a 6-8 week lead time prior to the beginning of a serious decline where both showed increasingly choppy behavior.

2015.

2018

Conclusions.  I turned cautiously bearish as the SPX crossed 3240 as I felt that the risk out weighed the rewards with almost 1000 pts gain since last Dec at 2350.  There are no clear signals to become aggressively bearish.  Although the corona virus may all that is required to start a sharp downturn like the avian flu Oct 2014, I hate to be a trend follower.  INT outlook as shown by the volume analysis still shows the potential for a longer topping pattern, but this time may be different.

Weekly Trade Alert.   There does seem to be a good possibility of a 4% drop to the 100 SMA at SPX 3200 before an ATH retest similar to 2015.  Last Fri SPX P/C jumped to 2.25, the highest since Dec 8 and 18, and both were followed by 50 pt rallies over the next week, but early Oct 2018 the same levels were followed by further declines.  Updates @mrktsignals.

Investment DiaryIndicator Primer,  update 2019.04.27 Stock Buybacks, update 2018.03.28  Dumb Money/Smart Money Indicators
Article Index 2019 by Topic
Article Index 2018 by Topic
Article Index 2017 by Topic
Article Index 2016 by Topic
Long term forecasts

© 2020 SentimentSignals.blogspot.com

Saturday, January 18, 2020

Are Low Equity P/C Ratios an Immediate Cause for Concern

The press and several notable market pundits are using an extremely low Equity Put/Call Ratio as a sign of an imminent market top, but in the past I have noted that the Equity P/C is a component of the smart money in the DM/SM options indicator.  In the past, I have used several examples such as the Nov 2017-Jan 2018 period where the market continued to rally even though the Equity P/C was low.  So today I want to take a more analytical approach with the data mining software developed last summer using the spread of the Equity P/C to CPC Revised (less VIX options) and as shown in the Tech/Other section, a low relative Equity P/C is more often bullish than not.

Over the last couple of weeks I have received a couple of inquiries about my annual long term forecast, but to tell the truth there several political factors, ie, the Trump impeachment, the election, China/Hong Kong developments, and repo problems, that raise major unknowns and make it difficult to consider long term outlooks.  Also this summer, several months were spent in software development where I fell behind in updating the article index and also I want to add a new section to the Investment Diary describing the data mining results, so both of these take priority.  That being said, in the Tech/Other section I will provide an interim outlook, where I think we are approaching a top equivalent to July 2007 that was followed by a 10% correction then a double top in Oct before a larger decline Jan 2008 (18%) and a final failed rally into May before the bottom fell out for the stock market later 2008.

For the shorter term, looking over the SPX charts, I noticed that the rally off the Aug 2015 and Feb 2016 lows at 1810 was a total of SPX 1063 pts to the Jan 2018 highs.  So if this is an ABC rally with Jan 2018 the top of A, Dec the bottom of B at 2347, then a C = A rally should top at SPX 3410.  This matches some of the Fibs I've seen and aligns with the NDX megaphone top at 9200-50 as well as DJIA at 30K.


I. Sentiment Indicators

The overall Indicator Scoreboard (INT term, outlook two to four months) bearish sentiment remains at extreme lows which is likely pointing to a more important top than previously seen on Jan and Oct 2018.


The INT view of the Short Term Indicator (VXX $ volume and Smart Beta P/C [ETF Puts/Equity Calls], outlook two to four months) bearish sentiment showing higher prices followed lower bearish sentiment followed by lower prices.  When will the dam break?


Bonds (TNX).  Bond investors seem to be more fearful of higher stock prices than they are of higher interest rates.  Last week the Trump team announced a possible "middle class" tax cut by reducing earned income and payroll taxes, look for an explosion in the deficit and higher rates if passed.


For the INT outlook with LT still negative, the gold miners (HUI) bearish sentiment not sure what gold bugs are smoking but fate will likely follow that of bond holders.


II. Dumb Money/Smart Money Indicators

The option-based Dumb Money/Smart Money Indicator as short/INT term (outlook 2 to 4 mns/weeks) LT EMAs showing lowest bearish sentiment of last two years that means a ticking time bomb.


And the sister options Hedge Ratio sentiment is freaking me out.


The INT term SPX Long Term (2x/DM) ETFs (outlook two to four weeks) bearish sentiment is looking more like the Jan rounded bottom that may indicate a sharp downturn ahead.


The INT term NDX Long Term (2x/DM) ETFs (outlook two to four weeks) bearish sentiment is similar to the SPX ETF measure.


Finally, the Safety Trade Indicator (SPX/TNX ETFs) shows that bond holders are stubbornly clinging to Gollum's "precious".  One scenario that may work out is a stock consolidation thru the impeachment, a final pop, middle tax cuts go thru, bonds and stocks decline.

III. Options Open Interest

Using Thur closing OI, remember that further out time frames are more likely to change over time, and that closing prices are more likely to be effected.  This week I will look out thru Jan 24. Also, This week includes a look at the TLT for Feb exp.

With Fri close at SPX 3330, options OI starts light but increases during the week, showing heavy resistance over 3300.  The spread SPX puts/ETF calls remains slightly positive. Tue, some weakness may push the SPX to the low 3300s.


Wed has somewhat larger OI where SPX 3320 is the key.  Under that level 3275 is possible, over it, there is little resistance to the upside.


For Fri, large OI may influence weekly behavior where parameters are much like Wed.  SPX 3320 is the key where below it, 3300 is likely, but over, there is only small resistance to 3365.


Using the GDX as a gold miner proxy closing at 28.4.  Last weeks resistance at 30 held, although GDX stayed above the target range of 26-8.

Currently the TLT is 138 with the TNX at 1.84%.  Overlapping straddles at 138 and 140 are likely to keep prices in that range or close to it.


IV. Technical / Other

A. Data Mining Indicator Updates.  First, the Crash Indicator has continued to curl upward after stopping just short of the -2 SD level, and likely indicates a non-crash correction similar to May and Aug of 2019, although likely more severe (10%).


The VIX Call Indicator (spread to CPC Revised) has finally reached an official SELL level with Fri the highest level of calls yet, this means that a sharp decline is likely to start over the next two to three weeks.


And finally, a look at the Equity P/C spread (CPC Revised less CPCE).   The Equity P/C (green) is a component of the smart money in the option-based DM/SM Indicator, and below you can see that the Equity P/C spread (blue) typically reaches its high point prior to a sharp rally, not at the top as many believe and typically sees a decline to neutral or lower at tops.  For instance in Jan 2018, the peak was at the beginning of Jan before the meltup and for the Sept-Oct 2019 top peaked in early July.  Currently the spread is still rising, indicating that higher prices are still likely.


B. Long Term Outlook.  First, a look at the SPX price chart from 2009-20.  I have seen some analyst who look at the tops of rallies since 2009 (mid-line) to show that the SPX is a breakout that indicates several hundred pts higher is likely.  Personally, I prefer to start with the bottoms, since bottoms usually represent stronger sentiment (panic lows).  Drawing parallel lines between the bottoms and the 2007 high currently shows a top in the lower 3400's close to the 3410 mentioned above.  Note the Dec 2018 low did not reach the lower trend line at about 2250.  This was one of the reasons I called for a bottom in Dec 2018 around 2350, since most analysts called for a low near 2250 once the Feb low of 2500 was broken.  Many times popular targets become "fake outs" and markets turn prematurely.


Next, a look at the long term CPCE from Stockcharts back to 2003 charted as 1/CPCE for consistency with the "spread" chart also using 10 day SMAs, you can see the LT upward trends normally coincided with low CPCE (or high 1/CPCE).  My conclusion considering all other sentiment is that we are approaching a top similar to July 2007 where there will be one or more (SPX 2015, DJIA 2000-2001) retests of the high before rolling over with an eventual decline to the low SPX 2000s.  Other sentiment includes the Safety Trade Indicator shown above (SPX/TNX ETFs) that is now on a BUY while several months of SELLs were seen mid-2018 before the Q4 selloff and the LT $NYUPV/$NYDNV that remains in consolidation mode similar to 2016 rather than the sharp downturn (100 SMA, red) seen before the Aug 2017 and Oct-Dec 2018 declines.


Conclusions.  Overall, INT sentiment is becoming downright scary with consistently lower bearish levels than seen over the last two years, but this is what should be expected if a larger 30%+ decline were likely.  I remember a couple of years ago when I used a select group of indicators to look at the 2007-09 period, and bearish sentiment was lower on May of 2008 at DJIA 13K than it was Oct 2007 at 14K.

ST, however, more upside seems likely.  The VIX Call Indicator is warning of a downturn that may be two to three weeks away.  A new indicator using the Equity P/C to combined P/C spread shows that smart money is still buying equity calls, while trend lines are showing that major resistance resides just above SPX 3400.

LT, we may be at the cusp of a moderate bear market with the potential for a 30-40% correction that could see multiple high retests of the highs (while Safety Trade remains positive) and stretch over a couple of years similar to the DJIA from 2000-2002.  I doubt if there is a repeat of the tech disaster, but if further confrontation with China leads them to place restrictions on the export of rare earth elements (retalation to Huawei ban), it would cause major disruptions in the the tech sector.

Weekly Trade Alert.  Uncertainty over the markets reaction to Trump's impeachment as well as mixed ST sentiment makes up/down a 50/50 call.  A continued rally, which seems likely, increases the likelihood of a negative reaction with problems for Trump surfacing in the impeachment process, while a pause may be a setup for a final fling if he is cleared.    Updates @mrktsignals.

Investment DiaryIndicator Primer,  update 2019.04.27 Stock Buybacks, update 2018.03.28  Dumb Money/Smart Money Indicators
Article Index 2019 by Topic
Article Index 2018 by Topic
Article Index 2017 by Topic
Article Index 2016 by Topic
Long term forecasts

© 2019 SentimentSignals.blogspot.com

Saturday, January 11, 2020

Hail to the Stockbroker in Chief

Trump Filp-Flops on Iran and Stocks Soar as Safety Trade crumbles.  Sunday's over night S&P futures (ES) fell almost 60 pts which was enough for Trump to announce there would be no escalation in reprisal to the Iranian missile attacks.  It's beginning to feel surreal to see a US President that seems more intent on managing the stock market than he does managing the economy or the global political situation.

Bearish sentiment remains near/below the lowest extremes seen over the last two years, but the question remains as to when there will be a negative effect on prices.  Trader Joe concluded on Fri that the top was in for his (a) wave and the SPX is starting a move down to 3000+, dropping his option Thur for a move over 3300 first.  The biggest problem I see with this option as posted on Twitter Fri AM was that Thur was the first day of a significant increase in VIX call volume, which I have been patiently waiting for as a topping sign (charts in Tech/Other).  Compared to Jan 2018 we saw two weeks of elevated VIX call buying starting on Jan 3, more than three weeks before the final high.  Similar timing to 2018 would put a top in late Jan or early Feb.

Last week was a surprising breakout as a consolidation range was expected, but was likely due to a bout of short covering as a result of the latest flip-flop from our get-tough POTUS.

I. Sentiment Indicators

The overall Indicator Scoreboard (INT term, outlook two to four months) bearish sentiment last week reached the lowest level over all time frames for the last two years.


The INT view of the Short Term Indicator (VXX $ volume and Smart Beta P/C [ETF Puts/Equity Calls], outlook two to four months) bearish sentiment is also hovering around the lowest level of the last two years.


Bonds (TNX) bearish sentiment also remains at the lowest level seen the last two years.


And as a result the Safety Trade Indicator (SPX/TNX ETFs) remains a positive influence for the SPX due to the excessive caution of bondholders, although this may be more indicative of a BTFD on weakness as this indicator was early in June and Sept 2019.


For the INT outlook with LT still negative, the gold miners (HUI) bearish sentiment was little deterred on last week's pullback, and has also reached new lows for the last two years.


II. Dumb Money/Smart Money Indicators

The option-based Dumb Money/Smart Money Indicator as short/INT term (outlook 2 to 4 mns/weeks) saw a brief blip upward Mon, but resumed its downward trend later in the week at similar levels to Jan and Dec of 2018 and July 2019.


And the sister options Hedge Ratio sentiment is pretty much in sync with the DM/SM Indicator.


The INT term SPX Long Term (2x/DM) ETFs (outlook two to four weeks) bearish sentiment has fallen more than the options indicators and supports possible strength ahead.


The INT term NDX Long Term (2x/DM) ETFs (outlook two to four weeks) bearish sentiment seems to be in a rising trend similar to Jun-Oct 2019 with NDX prices nearing the top of what appears to be a megaphone or expanding wedge pattern with the potential for gains to 9200-50.


III. Options Open Interest

Using Thur closing OI, remember that further out time frames are more likely to change over time, and that closing prices are more likely to be effected.  This week I will look out thru Jan 17 also EOM. Also, This week includes a look at the GDX for Jan.

With Fri close at SPX 3265, options OI is light all week, but the spread SPX puts/ETF calls has turned somewhat positive.  Moderate put support is at 3225 while stronger call resistance is at 3275.  Likely range 3250-70.  Weakness late Fri may have increased put support.


Wed shows less put support, but a move over SPX 3260 has less call resistance to higher prices, so a positive China trade deal announcement could approach 3300.


For Fri PMs, there is larger OI and more call resistance at 3250, so a run up Wed to 3300 could easily reverse to 3250.


For Jan 31 EOM, there is large resistance at SPX 3300 as well as a large straddle at 3250 that could attract closing prices.


Using the GDX as a gold miner proxy, currently 28.45.  For Jan exp, strong resistance remains at 30 with little net put support until 25.  Likely range 27-28.


Last week with the TLT at 139.1 some weakness was expected due to strong resistance at 140 and support at 138 and prices dropped to 137+ before bouncing back to 138.4.

IV. Technical / Other

As mentioned above, the VIX Call Indicator (relative to CPCRevised) has started to move down after being in positive territory (low vol) the last couple of months, but is expected to move lower before a significant (5%+) decline.


VIX puts are also likely to show higher vol as Dumb Money bets on lower VIX.


The Crash Indicator has managed to hold above the -2 SD level and appears to be putting in a rounded bottom similar to Sept 2018, and Apr and July 2019.


Conclusions.  A top is likely near in the SPX that could produce a 5-10% decline with the 200 SMA at 3000 a likely target.  Some believe that a top was made last week just above 3280, but certain indicators including the SPX 2X ETFs and VIX Call Indicator are showing a more likely top around the EOM Jan.  The Safety Trade Indicator SPX/TNX ETFs are showing that this will be a BTFD oppty, not an INT/LT top.  It is very possible that the SPX holds up into the election with a Q4 blowup similar to 2018 to encourage bondholders to move into stocks with the DJIA at 30K+.

Weekly Trade Alert.  ST volatility will likely continue where further advances are followed by retracements similar to late last week.  Updates @mrktsignals.

Investment DiaryIndicator Primer,  update 2019.04.27 Stock Buybacks, update 2018.03.28  Dumb Money/Smart Money Indicators
Article Index 2019 by Topic
Article Index 2018 by Topic
Article Index 2017 by Topic
Article Index 2016 by Topic
Long term forecasts

© 2019 SentimentSignals.blogspot.com