
Bearish sentiment remains near/below the lowest extremes seen over the last two years, but the question remains as to when there will be a negative effect on prices. Trader Joe concluded on Fri that the top was in for his (a) wave and the SPX is starting a move down to 3000+, dropping his option Thur for a move over 3300 first. The biggest problem I see with this option as posted on Twitter Fri AM was that Thur was the first day of a significant increase in VIX call volume, which I have been patiently waiting for as a topping sign (charts in Tech/Other). Compared to Jan 2018 we saw two weeks of elevated VIX call buying starting on Jan 3, more than three weeks before the final high. Similar timing to 2018 would put a top in late Jan or early Feb.
Last week was a surprising breakout as a consolidation range was expected, but was likely due to a bout of short covering as a result of the latest flip-flop from our get-tough POTUS.
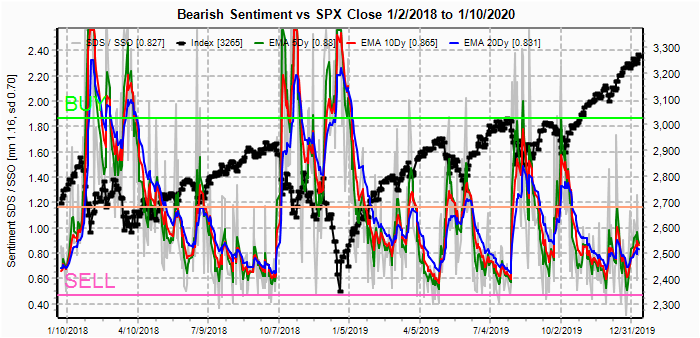
I. Sentiment Indicators
The overall Indicator Scoreboard (INT term, outlook two to four months) bearish sentiment last week reached the lowest level over all time frames for the last two years.

The INT view of the Short Term Indicator (VXX $ volume and Smart Beta P/C [ETF Puts/Equity Calls], outlook two to four months) bearish sentiment is also hovering around the lowest level of the last two years.

Bonds (TNX) bearish sentiment also remains at the lowest level seen the last two years.

And as a result the Safety Trade Indicator (SPX/TNX ETFs) remains a positive influence for the SPX due to the excessive caution of bondholders, although this may be more indicative of a BTFD on weakness as this indicator was early in June and Sept 2019.

For the INT outlook with LT still negative, the gold miners (HUI) bearish sentiment was little deterred on last week's pullback, and has also reached new lows for the last two years.

II. Dumb Money/Smart Money Indicators
The option-based Dumb Money/Smart Money Indicator as short/INT term (outlook 2 to 4 mns/weeks) saw a brief blip upward Mon, but resumed its downward trend later in the week at similar levels to Jan and Dec of 2018 and July 2019.

And the sister options Hedge Ratio sentiment is pretty much in sync with the DM/SM Indicator.

The INT term SPX Long Term (2x/DM) ETFs (outlook two to four weeks) bearish sentiment has fallen more than the options indicators and supports possible strength ahead.
The INT term NDX Long Term (2x/DM) ETFs (outlook two to four weeks) bearish sentiment seems to be in a rising trend similar to Jun-Oct 2019 with NDX prices nearing the top of what appears to be a megaphone or expanding wedge pattern with the potential for gains to 9200-50.

III. Options Open Interest
Using Thur closing OI, remember that further out time frames are more likely to change over time, and that closing prices are more likely to be effected. This week I will look out thru Jan 17 also EOM. Also, This week includes a look at the GDX for Jan.
With Fri close at SPX 3265, options OI is light all week, but the spread SPX puts/ETF calls has turned somewhat positive. Moderate put support is at 3225 while stronger call resistance is at 3275. Likely range 3250-70. Weakness late Fri may have increased put support.

Wed shows less put support, but a move over SPX 3260 has less call resistance to higher prices, so a positive China trade deal announcement could approach 3300.

For Fri PMs, there is larger OI and more call resistance at 3250, so a run up Wed to 3300 could easily reverse to 3250.

For Jan 31 EOM, there is large resistance at SPX 3300 as well as a large straddle at 3250 that could attract closing prices.

Using the GDX as a gold miner proxy, currently 28.45. For Jan exp, strong resistance remains at 30 with little net put support until 25. Likely range 27-28.

Last week with the TLT at 139.1 some weakness was expected due to strong resistance at 140 and support at 138 and prices dropped to 137+ before bouncing back to 138.4.
IV. Technical / Other
As mentioned above, the VIX Call Indicator (relative to CPCRevised) has started to move down after being in positive territory (low vol) the last couple of months, but is expected to move lower before a significant (5%+) decline.

VIX puts are also likely to show higher vol as Dumb Money bets on lower VIX.

The Crash Indicator has managed to hold above the -2 SD level and appears to be putting in a rounded bottom similar to Sept 2018, and Apr and July 2019.

Conclusions. A top is likely near in the SPX that could produce a 5-10% decline with the 200 SMA at 3000 a likely target. Some believe that a top was made last week just above 3280, but certain indicators including the SPX 2X ETFs and VIX Call Indicator are showing a more likely top around the EOM Jan. The Safety Trade Indicator SPX/TNX ETFs are showing that this will be a BTFD oppty, not an INT/LT top. It is very possible that the SPX holds up into the election with a Q4 blowup similar to 2018 to encourage bondholders to move into stocks with the DJIA at 30K+.
Weekly Trade Alert. ST volatility will likely continue where further advances are followed by retracements similar to late last week. Updates @mrktsignals.
Investment Diary, Indicator Primer, update 2019.04.27 Stock Buybacks, update 2018.03.28 Dumb Money/Smart Money Indicators
Article Index 2019 by Topic
Article Index 2018 by Topic
Article Index 2017 by Topic
Article Index 2016 by Topic
Long term forecasts
© 2019 SentimentSignals.blogspot.com
The end of the month certainly makes more sense to me as well Arthur. Next week earnings start coming out and that could keep stocks dancing up and down, which might make for a small wave 4 down to 3250 SPX and back up to 3300 for the wave 5 the week after?
ReplyDeleteI do agree that a nice move down is coming, but I'm not sure on how much? Your 3000 target is a pretty big drop but I'd love to catch it if it happens. I was only looking for a move down of say 150 points or so, which would be 3150 from a 3300 top. But I'll take whatever the market gives me.
After the drop though I also think we'll rally back up strong due to the election and all. There's a important period in July/August of this year that should put in the low for the year. This is based on Hurst work and explained is this video (https://www.youtube.com/watch?v=s-X6fCHFzF0).
Possibly we drop for that 150 points I'm looking for first to make a large A wave down of some degree, that ends in say March? Then back up for the B wave into April/May and down the C wave into July/August? From there we rally hard into the election and beyond?
Just trying to put all the pieces together. Thanks as always for your attention to detail in your weekend posts.
Red
Excellent analysis! Thank you for your work!
ReplyDeleteThanks, Arthur! Will you publish a long term forecast this year?
ReplyDelete