Last week started out as expected with a carry over of upside momentum into Mon/Tue carrying the SPX up to the 4522 level, but the mid-week pullback only lasted thru Wed to 4466 (-66pts vs expt -100+ pts). The reason primarily was a sharper than expected selloff in bonds with money flowing into stocks for inflation protection. This weeks Tech/Other section takes a closer look at the SPX/TNX trends from late 2017-18 and rates are running well ahead of that period. If the current trend continues (which seems likely based on higher CPI comparisons), a continued rise in rates (TNX) toward 3.5% (current 2.5%) could cause a dislocation in stocks of 15-20% similar to Jan-Feb 2018, where 3.5% is twice the DJIA div yield and may cause reverse asset allocation. Ultimately TNX rates are likely to reach 4-4.5% over the next 12-18 mns based on inflation comparisons.
Looking at the performance of INT bonds using the 20 yr TLT ETF, prices are down 10% in the month of Mar and 17% since Dec. Currently at 128 vs Dec 155, a 12-18 mn target of 100 or par seems reasonable, especially considering the TBT/TLT ETF sentiment indicator which shows a drop in bearish sentiment as BTFD is strong in the retail bond sector.
Current sentiment outlook is for several more weeks of higher prices with ST trends likely influenced by int rates (TNX). One EW analyst with a good ST record expects SPX 4700+ by mid Apr.
I. Sentiment Indicators
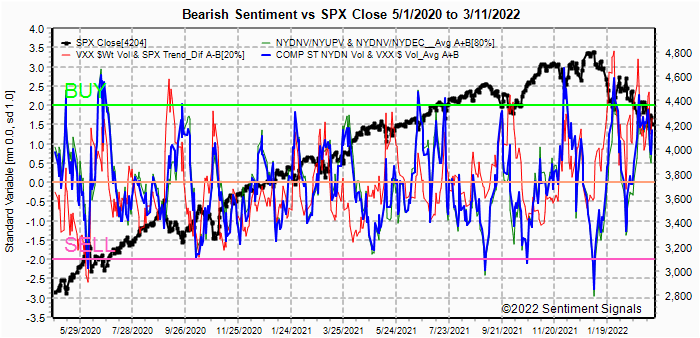
The INT/LT Composite indicator (outlook 3 to 6+ months) has three separate components. 1st is the SPX and ETF put-call indicators (30%), 2nd the SPX 2X ETF INT ratio (40%), and 3rd a volatility indicator (30%) which combines the options volatility ratio of the ST SPX (VIX) to the ST VIX (VVIX) with the UVXY $ volume.
Update. Bearish sentiment continues to drop, but remains well above neutral.

Update. Bearish sentiment has dropped below neutral which may result in some consolidation similar to June 2020 before a 200 pt run up and a more serious correction.

Update. Bearish sentiment remains slightly above neutral, similar to early June 2020.

Update EMA. Bearish sentiment is coming off a similar high as seen in June 2020.


Update. Bearish sentiment overall is unchanged as ETF sentiment is offset by higher int rates with prices consolidating near the recent highs.

II. Dumb Money/Smart Money Indicators
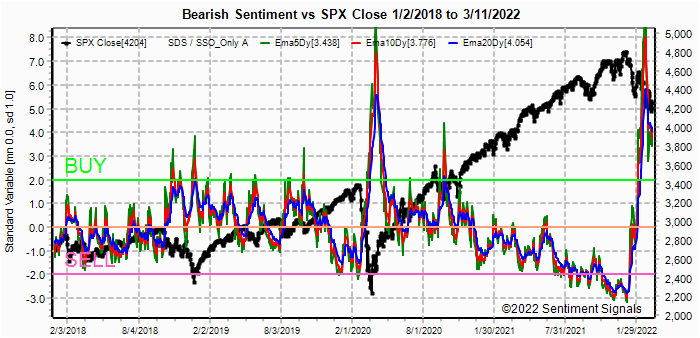
This is a new hybrid option/ETF Dumb Money/Smart Money Indicator as a INT/LT term (outlook 2-6 mns) bearish sentiment indicator. The use of ETFs increases the duration (term).
Update. Bearish sentiment has fallen sharply but remains well above neutral.


III. Options Open Interest
Using Thur closing OI, remember that further out time frames are more likely to change over time, and that closing prices are more likely to be effected. Delta hedging may occur as reinforcement, negative when put support is broken or positive when call resistance is exceeded. This week I will look out thru Apr 1. A text overlay is used for extreme OI to improve readability, P/C is not changed.
With Fri close at SPX 4543, options OI for Mon is very small and the verall high P/C and huge Thur put positions at 4510 and 20 may provide enough support to keep prices near current levels.


For Fri (Mar jobs/payroll data) moderate OI shows strong call resistance at 4550 and over and if 4500 is broken to the downside, there is little put support until 4450.

IV. Technical / Other
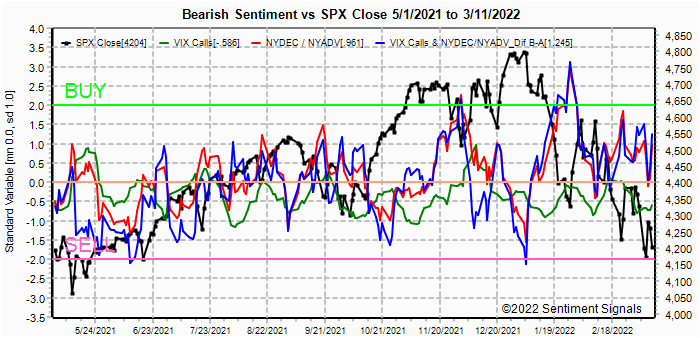
Looking for some way to estimate the outllook for Apr, I decided to look at VIX options. First, the VIX call indicator continues to look more bearish, but notice for Mar & Oct 2021 there was a 4-6 week lead before a market downturn.

So next, I looked at the VIX options OI for Apr 20 which looks bearish based on # of contracts, but then I noticed that ATM call prices were 3x ATM puts which shows strong call resistance at 25 and a very low P/C $. Therefore the bias is likely for a lower VIX thru mid-Apr which means higher stock prices. (Note at 100 units/contract, $ amnts are x 100)

Turning to the SPX vs TNX rate outlook, I noticed that from late 2020 thru mid 2021 SPX rose with int rates, but from mid 2021 thru early 2022 they moved in opposite directions after rates hit the DJIA div yield at 1.7%. Now, in Mar, they are again moving together.

Looking only at the SPX during the melt up phase from Sept 2017 thru Jan 2018, all of the declines were 1-2% and were immediately BTFD which may explain the smaller than expt decline last week.

Looking at the SPX vs TNX rate performance for 2017-18, rates started at a lower level in Mar 2022 at 1.7% vs 2% in Sept 2020, but last week rose to the same 2.5% in the first month. There may be a consolidation at 2.5% as in 2017, but I expect rates to continue to rise over the next few weeks. If rates continue to rise toward 3.4% (2x DJIA div yld), we could see a dislocation (crash) similar to the Jan-Feb 2021 decline (at 2.7%) to test the SPX lows at 4100 or lower.

Conclusions. The early comparison of SPX ETF sentiment to the pre-melt up period of late 2017 has been proven correct so far, and if anything the rise in both int rates and stock prices have been stronger than expected. As noted in the Tech/Other section, the rapid rise in rates may create a more serious problem if we see a more immediate rise to TNX 3%+.
Weekly Trade Alert. Prices seem likely to rise with the SPX possibly approaching 4700 or higher by mid-Apr. Pullbacks may be limited to the 1-2% variety and are likely to reverse quickly. I have noticed a strong correlation each day between the direction of int rates and stock prices with rates usually leading. Updates @mrktsignals.
Investment Diary, Indicator Primer,
update 2021.07.xx Data Mining Indicators - Update, Summer 2021,
update 2020.02.07 Data Mining Indicators,
update 2019.04.27 Stock Buybacks,
update 2018.03.28 Dumb Money/Smart Money Indicators
Article Index 2019 by Topic, completed thru EOY 2020.02.04
Article Index 2018 by Topic
Article Index 2017 by Topic
Article Index 2016 by Topic
Long term forecasts
© 2022 SentimentSignals.blogspot.com