
The big news over last weekend was stronger sanctions against Russia with the vast majority of countries (even Switzerland, usually neutral) joining US/NATO where sanctions included SWIFT, oligarch yachts and even Apple pay apps. The Sun nite futures indicated an open at the top of last weeks expected SPX range (4400), but shortly after the news hit the bottom fell out pushing prices down to -110 pts or the bottom of the range (4250). Mon open showed some support, however, opening down only 50 pts. There is a theory that many such o/n swings turn out to be "b" waves and will be retested in a few days. In Wed testimony from Fed Chair Powell before Congress, he leaked the expected news that the FOMC would only raise 0.25% in Mar and this helped the SPX go from an open at 4320 to a high of 4401 (and Thur AM 4416), testing the top of the range. Now we have to wait and see if the bottom range is retested, and I expect the Thur CPI report next week to be the catalyst.
The selloff into Fri, especially in Europe, also raises the specter of a global financial crisis due to heightened uncertainty of the settlement of trade contracts that can be affected by sanctions, much like the settlement of sub-prime mtg contracts in 2008. The result was a sharp rise in the US$ and a flight to safety in bonds. This could result in a black swan type event with a prob of about 5-10%. See here for discussion.
Wed SPX rally was not the only financial asset to show a strong move as int rates (TNX) rose from 1.65% to 1.85% and many were surprised that stocks were not negatively effected. Looking back over the late 2017 China trade war period, I surprisingly found the same result. In fact, the entire melt up in stocks from Aug 2017 thru Jan 2018 was accompanied by a sharp rise in rates. That was also a period of FOMC tightening. A comparison of then and now is made in this weeks Tech/Other section.
I. Sentiment Indicators
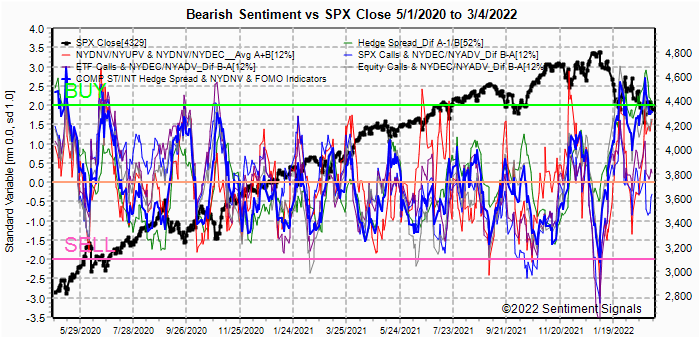
The INT/LT Composite indicator (outlook 3 to 6+ months) has three separate components. 1st is the SPX and ETF put-call indicators (30%), 2nd the SPX 2X ETF INT ratio (40%), and 3rd a volatility indicator (30%) which combines the options volatility ratio of the ST SPX (VIX) to the ST VIX (VVIX) with the VXX $ volume.
Update. Bearish sentiment retreated slightly with the largest drop in SPX ETFs.

Update/ ST sentiment also fell, but remains near the Buy level with Fri selloff.

Update. The ST/INT Composite also remains near a Buy level.
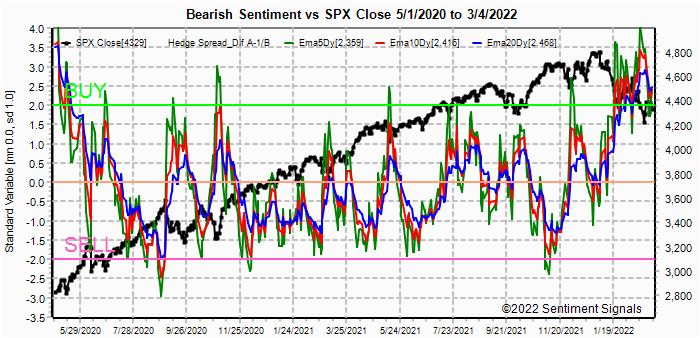
Update EMA. Saw a slight whipsaw but remains near a Buy.


Update. Bearish sentiment in gold stocks also fell sharply for the ETFs with some support from lower rates as the HUI broke out from the 250-85 trading range following gold and other commodities.

II. Dumb Money/Smart Money Indicators
This is a new hybrid option/ETF Dumb Money/Smart Money Indicator as a INT/LT term (outlook 2-6 mns) bearish sentiment indicator. The use of ETFs increases the duration (term).
Update. Bearish sentiment remains near its recent peak levels.


III. Options Open Interest
Using Thur closing OI, remember that further out time frames are more likely to change over time, and that closing prices are more likely to be effected. Delta hedging may occur as reinforcement, negative when put support is broken or positive when call resistance is exceeded. This week I will look out thru Mar 11 plus a Mar 18 opt exp preview. I am also trying a new feature to replace extreme OI with lower numbers to improve readability with changes shown as text, P/C is not changed.
With Fri close at SPX 4329, options OI for Mon is moderate at 4200 and 4300, and if 4300 holds the a move up to 4350-400 is possible.


For Fri Mar 18, very strong put support at SPX 4300, a high P/C and moderate put support up to 4450 should result in a rally to that level or higher.

IV. Technical / Other
This week I want to continue with the late 2017-18 analog with a look at int rates. The first chart represents the FOMC fed fund rate hikes from 2017. In 2017, there were two rate hikes the 1st six months and then a pause until Dec. I expect the Fed to take a similar approach with 2 or 3 hikes by June/July and then a pause until after the election (partially as a "wait to see the effect" and also for markets to recover from Ukraine invasion). Links: tables, charts.

The next chart compares the TNX rate with the SPX from late 2017. What is surprising is that unlike the last 6 to 8 mns when stocks were negatively affected by rising rates, the SPX rose and fell with rates. We saw an example of this last week when a sharp rise in rates presaged a sharp rise in stock prices, then vice versa on Fri. Note also that the beginning of the trade war with China saw a sharp drop in rates before a longer uptrend. I would expect to see a similar trend going forward for a positive outcome in stocks, mainly due to a asset allocation shift out of bonds to stocks for inflation protection.

Looking at the SPX 4-hr FX chart, there appears to be a H&S pattern that shows the potential for a move up Mon/Tue to the 4350-4400 area before a larger move down to the 4250 or lower. I am not recommending this, but signs of further contagion Thur/Fri (higher US$, lower TNX rates, EU markets) may risk a test of 4100.

Conclusions. Somewhat interesting, but over two weeks ago before the Ukraine invasion, the German DAX had a "death cross", which I warned to keep an eye out for in US markets (NDX made one last week) and now the last two weeks the DAX has fallen 15% vs 4% for the SPX. Failure for the SPX to rally over 4500 by end of Mar makes it likely for SPX. Otherwise, sentiment still supports a sizeable rally, but as pointed out in Tech/Other, the key for a "melt up" outcome will probably depend on the bond market, while signs of a financial contagion which keeps the US$ high and int rates low probably implies a more negative outcome.
Weekly Trade Alert. Sentiment and SPX options OI both seem to imply early week strength to 4350-400 before mid/late week weakness to the 4250 (or lower) area, while opt exp week and EOM point to 4400-4500+. Updates @mrktsignals.
Investment Diary, Indicator Primer,
update 2021.07.xx Data Mining Indicators - Update, Summer 2021 (in progress),
update 2020.02.07 Data Mining Indicators,
update 2019.04.27 Stock Buybacks,
update 2018.03.28 Dumb Money/Smart Money Indicators
Article Index 2019 by Topic, completed thru EOY 2020.02.04
Article Index 2018 by Topic
Article Index 2017 by Topic
Article Index 2016 by Topic
Long term forecasts
© 2022 SentimentSignals.blogspot.com
Thanks for the update Arthur!
ReplyDeleteI agree there might be some upside into OpEx and EOM because of all the massive downside hedging that has been going on (especially since the Fed meets a few days before OpEx). That unwinding could fuel a shortcovering rally.