I. Sentiment Indicators
The overall Indicator Scoreboard (INT term, outlook two to four months) has moved back to its recent lows, indicating that the current move may be close to taking a breather. OntheMoneyUK last week discussed a DeMark setup that implies a run up to SPX 2880-90 before a 40-50 pt pullback.

The INT view of the Short Term Indicator (VXX $ volume and Smart Beta P/C, outlook two to four months) is in a similar pattern but slightly more bullish for prices short term.

Bond sentiment (TNX) surprisingly shows increased bearishness, probably due to expected Fed rate hikes, but a slow down in the economy could push the TNX to 2.5% even if the Fed fund rate rises to 2.5%.

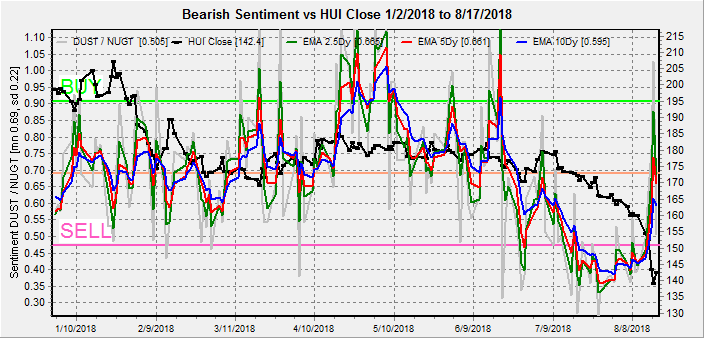
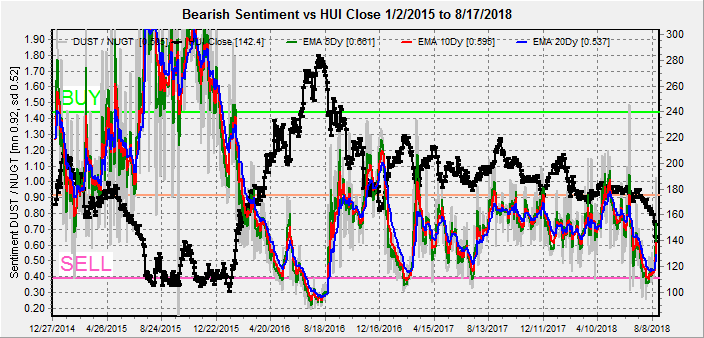
For the INT outlook with LT still negative, the gold miners (HUI) bearish sentiment finally pulled back to the neutral level following the near 40 pt waterfall decline in the HUI over the last month. We may see a consolidation for several weeks, but I still expect to see downward pressure to the 100 level by year's end.

II. Dumb Money/Smart Money Indicators
The Risk Aversion/Risk Preference Indicator (SPX 2x ETF sentiment/NDX ETF sentiment, outlook 2 to 4 days/hours) as a very ST indicator remains near the bottom of its TL.

The option-based Dumb Money/Smart Money Indicator as short/INT term (outlook 2 to 4 days/weeks) had dropped to a weak SELL early in the week, but closed the week at neutral.

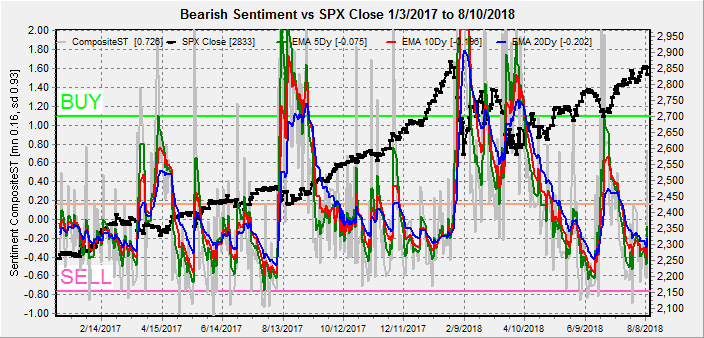
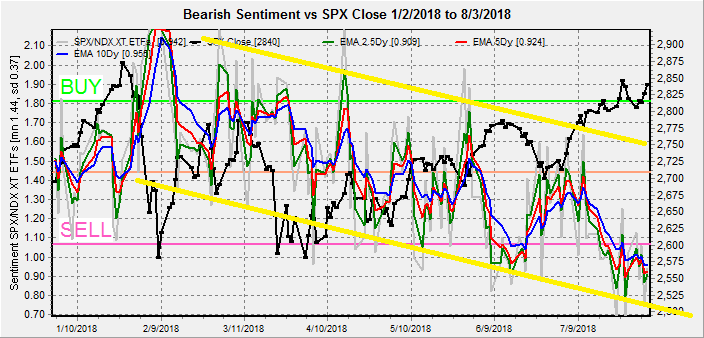
The INT term SPX Long Term/Short Term ETFs (outlook two to four weeks) bearish sentiment dropped significantly last week nearing a SELL that should see at least a weak pullback.

Long term neutral, the INT term NDX Long Term/Short Term ETF Indicator (outlook two to four weeks) pulled back from its recent highs, so the NDX may falter near the 7,500 level.

III. Options Open Interest / Other
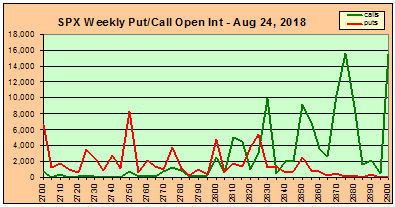
Using Thurs close, remember that further out time frames are more likely to change over time. This week I will look out thru Sept 7.
With Fri close at SPX 2775, Mon has very light resistance up to 2900 if the market rallies, while under 2775 the next support level is at 2850. Light open int overall.

Wed is somewhat similar except that strong resistance appears at SPX 2900. a push up to the 2890+ area seems likely by Wed.

Fri shows larger open int with significant call resistance starting at SPX 2870, and the 2850 and below show a lot of overlap. A move down to at least 2850 seems likely

For the following Fri, a jobs report day, the outlook is somewhat like the previous Fri, with support at SPX 2850 and high resistance starting at 2900. Some consolidation between 2850-2900 is expected.

I haven't looked at the VIX Call Indicator much since Jan, mainly due to very low reading, but recently volume has been picking up. Early Aug saw a drop to a new low at -48% 10 DMA/Avg and has recently moved over 0%. The last time we saw a reading this low and a move to 0% was Jan 2017. We then saw a small pullback, followed by a strong rally in Feb that moved the VIX Call Indicator to +50% before a two month correction.

Conclusions. Having made a new high in the SPX, some follow thru is to be expected over the next 2-3 days, but a 1-2% pullback is likely thereafter. A weak volume rally in Aug looks a lot like the setup in 2014 which saw a higher volume continuation in Sept thru opt exp, but a nasty Oct surprise.
Weekly Trade Alert. A move up to SPX 2890+ seems likely by Wed, but a pullback to 2850 into early Sept is indicated by the options open int. Updates @mrktsignals.
Investment Diary, Indicator Primer, update 2018.03.28 Dumb Money/Smart Money Indicators
Article Index 2018 by Topic
Article Index 2017 by Topic
Article Index 2016 by Topic
Long term forecasts
© 2018 SentimentSignals.blogspot.com