Saturday, February 23, 2019

Nearing a Short Term Top

So far my long term outlook from Dec 28th appears to be correct in that the Oct-Dec 2018 decline was not the start of a bear market, but simply a panic decline of nearly 20% similar to the 1998 LTCM crisis.  My preference is still that there will be lower lows. however, and that the current rally is simply a large B-wave correction of a larger decline.  So far the V-bottom has followed the Oct-Dec 2014 analog where a large impulsive wave would target SPX 2725-2825 or 80-90% of the full rally.  In 2014, the end of the impulsive wave was identified by reaching SELL levels in the sentiment Indicator Scoreboard and Short Term Indicator.

The past few days have brought the SPX very close to those levels.  The question remains as to how the top will form.  My preference is a pullback to the low 2700s next week, followed by a second top around the March optn exp on the 15th, then a second decline to the mid-2600s.  Important news events are the Mueller results that may come out the next couple of weeks, the jobs report March 8th, and the FOMC March 19-20.

I. Sentiment Indicators

The overall Indicator Scoreboard (INT term, outlook two to four months) bearish sentiment dropped sharply last week reaching the SELL level for all but the longest EMA.


Comparing this to the 2014 analog, we have now reached the level close to the first double top in late Nov 2014.


The INT view of the Short Term Indicator (VXX+VXXB $ volume and Smart Beta P/C, outlook two to four months) bearish sentiment has also declined to SELL levels comparable to other significant tops in 2018.


Bond sentiment (TNX) is still looking like the Jun-Sep 2018 period where a three month consolidation was seen before a sharp runup in rates.


For the INT outlook with LT still negative, the gold miners (HUI) bearish sentiment has remained at low levels, but as seen in the past has not stopped rallies supported by a weaker US$ and low TNX rates.


And for the ST view,  bearish sentiment remains above the SELL level so it is hard to say if a top is in.


II. Dumb Money/Smart Money Indicators

The Risk Aversion/Risk Preference Indicator (SPX 2x ETF sentiment/NDX ETF sentiment, outlook 2 to 4 mns/wks) as a INT indicator still shows strong risk preference that may limit advances and could be following a pattern from Oct-Nov 2018.


The option-based Dumb Money/Smart Money Indicator as short/INT term (outlook 2 to 4 mns/weeks) has been declining gradually that may indicate a longer topping period.


And comparing to the 2014 analog, we are still missing the sharp declines in sentiment seen before the Dec 2014 top.


While its sister sentiment indicator the Hedge Ratio, does show the sharper declines in sentiment that would be consistent with a somewhat more violent double top than what was seen in 2014.


The INT term SPX Long Term/Short Term ETFs (outlook two to four weeks) bearish sentiment still remains very low resulting from continued buying by dumb money (2x) while smart money (3x) remains neutral.


Long term neutral, the INT term NDX Long Term/Short Term ETF Indicator (outlook two to four weeks) as the long cycle seems to follow prices, the short cycle has remained at very low levels.


III. Options Open Interest

Using Thurs close, remember that further out time frames are more likely to change over time, more recently as shown with last weeks daily updates, more puts seem to be added one/two days before expiration.  This week I will look out thru Mar 1.

With Fri close at SPX 2793, Mon looks like the most bullish day of the week with put support up to 2775 and call resistance ar 2800 and stronger at 2815.  A push to 2810 could be reversed to below 2800 by the end of day.  Light open int overall.


Wed has strong put support at SPX 2750 and 2710, and if SPX remains below 2800 call resistance could push prices to 2775 or lower.


For Thur EOM with very large open int, the overlaps at SPX 2725, 2750 and 2775 may allow prices to swing either up to 2800 or down to 2700 or below.  Updates may clarify.


Fri currently has a very bearish outlook where call resistance is greater than put support above SPX 2700.  The Mueller report was supposed to come out this week, but has been delayed, so I don't expect anything much below 2725.


IV. Technical Other

Comparing $SKEW to 2014, a similar rise occurred Dec-Feb 2018 as Oct-Sec 2014. note that the retest in SPX Aug 2015 did not occur until several months after the $SKEW retested its previous lows.


Conclusions.  Sentiment is now at or near levels that indicate most of the rally off the Dec lows is over, but as was seen after the Oct 2014 and Aug 2015 lows several months of distribution are likely before a retest.  The $SKEW compared to 2014 shows that a retest of the EMAs below 120 will probably proceed a retest.  Options OI show that a high could occur early next week between SPX 2800-2815 and then decline sharply thru the end of week.  Possibly, with the China trade deadline scheduled for Mar 1, lack of concrete agreements may lead to a set back in stock prices.

Weekly Trade Alert.  Heads up for some potential volatility with a Mon/Tue high above SPX 2800 followed by a decline toward the 2720s.  Updates @mrktsignals.

Investment DiaryIndicator Primer,  update 2018.03.28  Dumb Money/Smart Money Indicators
Article Index 2019 by Topic
Article Index 2018 by Topic
Article Index 2017 by Topic
Article Index 2016 by Topic
Long term forecasts

© 2019 SentimentSignals.blogspot.com

Friday, February 22, 2019

Article Index 2019 by Topic

2019.01 #0 Long term forecast. Does Volume Lead Prices? A look at three major topics for the year ahead - china trade talks, Fed reserve policy, and Mueller investigation. A look at three analogs (1998 LTCM crisis as most likely, 2010-2011 corrections, and 1970s) using $NYUPV/$NYDNV as a volume measure and $SKEW from 1994-2018. Concl - no major bear market likely.

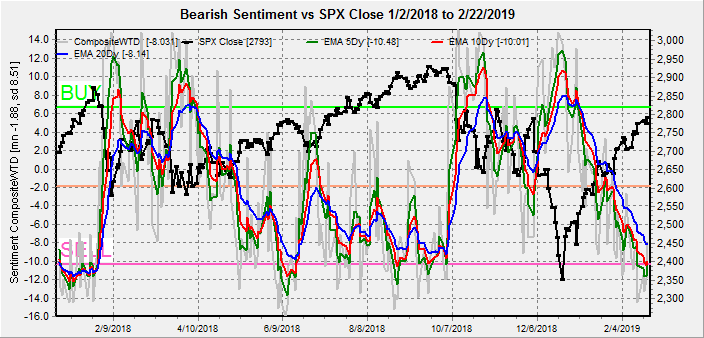
2019.01 #1 Still strong bearish sentiment similar to Mar-Apr retest lows pointing to higher prices ahead. Volume indicator strong. AAPL guidance may be EPS warning.
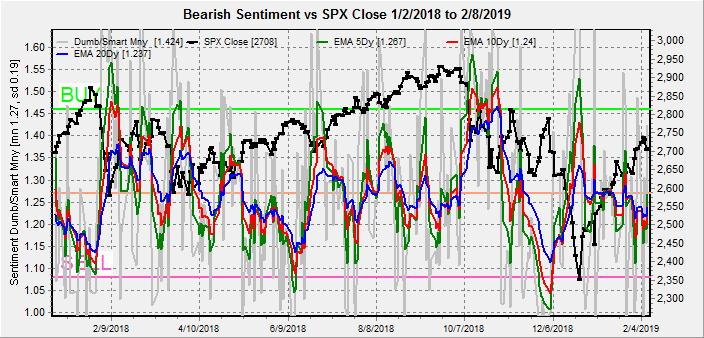
2019.01 #2 Smart money aka SPX ETF indicator lagging sentiment, likely B-wave indicator pointing to weakness/retest later in year. Tech Indic Comp at extreme levels seen at 50% rally off Feb 2016 lows, may pt to SPX 2850.
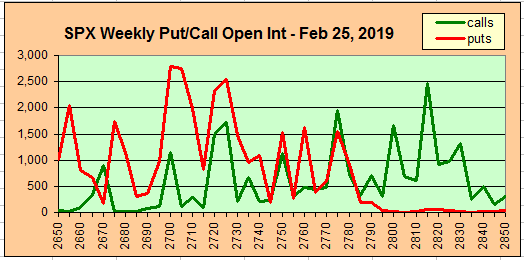
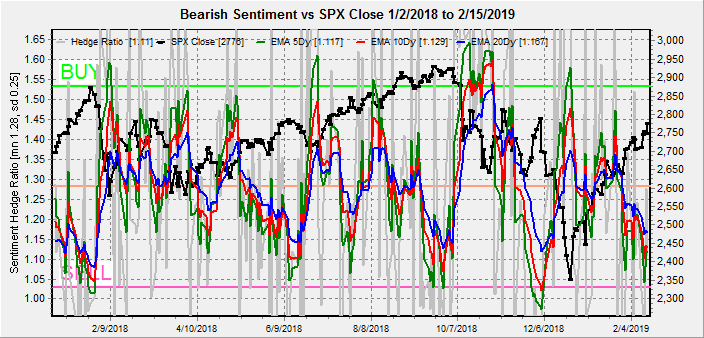
2019.01 #3 Possible setup for a V-bottom rally to continue with overall sentiment dropping to neutral. Use of Hedge Ratio compared to 2015 and 2016 retests of lows shows more rally ahead. Options OI still bullish.
2019.01 #4 Overall sentiment remains near neutral. Tech Indic $SKEW and $NYUPV/$NYDNV support more rally, no bear market in sight.
2019.02 #1 DJIA over 25k increases poss of V-bottom rally like Oct-Dec 2014, if so initial leg could extend to SPX 2725-2825 with final target of 2800-2900. Sentiment levels now below neutral, but in Dec 2014 reached SELL before larger decline.
2019.02 #2 SPX may consolidate between 2700-50 for a week or two. If bearish sentiment declines a 3-5% decline is possible, but DM/SM ETF indicators may indicate less pullback.
2019.02 #3 SPX at 2776 in mid range of 2725-2825 range for impulse wave of 2014 type V-bottom rally. Bearish sentiment nearing levels of Dec 2014 which was followed by 38% rally retrace, ST top may be days away with ST target 2800-25.
2019.02 #4 SPX nearing 2800 with ST sentiment indicating pullback to low 2700s. INT outlook several months before top.
2019.03 #1 "New" VIX call indicator issues SELL end of Feb w/SPX at 2804. SPX options OI shows weakness possible next two wks to mid, low 2700s.
2019.03 #2 SPX pullback underway at 2750, but sentiment indicators only neutral, so no bottom yet. May see bounce before further downside.
2019.03 #3 SPX soars above 2800 as Feds Powell interview on 60 min convinces public all is well. Int rates continue to fall with HUI moving up, inverse to bonds. SPX bearish sentiment very low, VIX put indicator shows SELL.
2019.03 #4 Dovish FOMC causes SPX to spike higher to 2850 then fall sharply to 2800. Strong move down in int rates. Apr TLT shows strong call resist at 125 (TNX 2.45%), so int rates may move up into mid Apr.
2019.03 #5 SPX moves upward to 2830s moving sentiment to neutral, but no sign of pullback. Int rates should reverse soon as TLT spikes over 126 and TNX below 2.4%.
2019.04 #1 Bonds may have completed a blowoff top. SPX sentiment & VIX put low volume indicating 1-2 wk volatility compression and similar top to June 2018 before 100 pt drop. Options OI show SPX 2910-20 possible.
2019.04 #2 Bonds & gold fall as inflation (PPI) rises. Sharp rise in VIX put buying may lead to SELL next week. SPX sentiment supporting pullback aka June 2018. Pullback into mid May may mean summer rally to SPX 3040.
2019.04 #3 Low overall bearish sentiment and esp low hedging could br pointing to more volatile decline ahead. SPX & NDX ETF sentiment not indicating INT top.
2019.04 #4 Continued low bearish sentiment and hedging show risk of pullback, but not INT top. Likely a rounded top that may extend into mid-2020. A look at how buybacks support EPS.
2019.05 #1 Correction may be starting, extreme lows in ST Indicator may pt to increase in volatility ahead. HUI bearish sentiment supports ST rally. Hedge ratio remains low. SPX may drop below 2900.
2019.05 #2 Correction underway, some increase in bearishness esp DM/SM optn indicator, means likely May opt exp rally, but low hedging and ST indicator pt to more downside afterward.
2019.05 #3 Same crowd that was calling for DJIA 30K a few weeks ago is now looking for the SPX to crash in Aug down to 24-2500, while overall pattern for SPX is still following fractal from Oct 2014 V-bottom indicating a 38% retrace then higher. Sharp increase in bearishness supports a rally soon after more volatility.
2019.05 #4 Bottom forming around SPX 2800, but expect more volatility implied by ST indicator.
2019.06 #1 Bearish sentiment has risen sharply w/recent decline, esp optns indicators. Expect bottom by EOW w/sharp rally into June exp to about SPX 2900.
2019.06 #2 Got expt sharp rally. Using LT sentiment from 2014 v-bottom shows weaker current sentiment, unlikely to repeat 50%+ rally from 2018 lows before sharp downturn.
2019.06 #3 Declining bearish sentiment indicates rally running out of steam with limited upside, but no imminent downturn expt. Starting graphics upgrade.
2019.06 #4 High vol optn exp may be warning of problems ahead resulting from distribution, Similar to Sept 2018 lead to slightly Oct, then downturn. Opt OI resistance at SPX 2950. Intro to data mining software.
2019.06 #5 Sharp decline in options sentiment is similar to Dec 2017 while ETF sentiment only moderate lower. Conclusion - minor pullback ahead followed by higher highs. Use data mining to look at Smart Beta P/C.
2019.07 #1 Very low bearish sentiment and high SPX call OI at 3000 and above with little put support until 2900 indicates risk of 3-5% pullback.
2019.07 #2 SPX powers over 3000 with bearish sentiment dropping to extremes of Apr 2019 top.
2019.07 #3 SPX drops 2% but bearish sentiment remains extremely low with more downside likely.
2019.07 #4 SPX back above 3000, but "new" VIX call indicator at SELL level, so expect significant pickup in volatility with 2-3% pullback likely.
2019.08 #1 Sharp drop for SPX following FOMC "sell the news" with volatility measures showing tradeable rally several weeks away. Bottom likely 2899 or lower,
2019.08 #2 Current likely to mirror Jan 2015 with move to new highs by EOY. Sharp rise in bearish sentiment indicates bottom likely in SPX low 2800s with several weeks more of volatility.
2019.08 #3 Bearish sentiment nearing levels of May selloff, but several weeks of bottoming likely. Intro to data mining crash indicator, now showing positive bias.
2019.08 #4 High bearish sentiment is setup for a year end rally, but low volatility measures indicate that volatility may not be over yet.
2019.09 #1 SPX saw strong bounce last two weeks off Aug lows, but high SPX put/call matching Dec 2018 indicates rally has more upside. Overall sentiment neutral. May see retrace of 50% before more rally.
2019.09 #2 A sharp drop in bearish sentiment during the week is warning of another ST pullback on possible "sell the news" after FOMC as possible setup for year end rally.
2019.09 #3 Bearish sentiment remains relatively low. Aka, March 2015 a sharp 50% retracement of rally since Aug lows will likely setup a rally of several months into May 2016 type high.
2019.09 #4 Analog to 2015 may be in jeopardy as SPX refuses to fall while level of call buying around 3000 is getting ridiculous. Sharp drop in hedge ratio warning of pickup in volatility,
2019.10 #1 Trump tweets and concern over the upcoming trade talks temporarily caused the SPX to drop 100 pts over two days before showing a strong rebound. Expected volatility finally did show up, but sentiment still too low to support a sustained rally. Expecting range 2825-2925 for a while.
2019.10 #2 SPX breaks out over 2950 and may have begun year end rally earlier than expected, upside target 3100-50. Bearish sentiment at lower levels than May and Aug 2019 pullbacks, but similar to June 2018 before rally to Oct top. A look at some indicator spreads using the datamining software.
2019.10 #3 Sharp drop in bearish sentiment may be predicting a pause/small pullback as SPX approaches 3000. Options OI indicates possible range 2950-3000. Addl vars for datamining using spread to CPCRev for SKEW, VIX calls & puts.
2019.10 #4 Risk rising for mini flash crash or SPX down 100+ pts in 2-3 days, likely to be setup for year end rally, Hedge ratio shows current low risk of volatility spike. Dataming shows low VIX P/C as positive for higher SPX.
2019.11 #1 A look at sentiment using 2x EMAs shows INT top not close but SPX 100 pt drop possible.
2019.11 #2 Bearish sentiment now approaching low extremes seen at May and July tops, but options sentiment showing moderate hedging to prevent immediate downturn. Datamining shows Crash Indic mildly neg & VIX options neutral.
2019.11 #3 Small SPX pullback (<1%) saw jump over neutral for options DM/SM and hedge ratio that may extend rally, but other sentiment indicators at low extremes. VIX options approaching -1 SD.
2019.11 #4 As SPX remains over 3100, overall bearish sentiment remains at low extremes where sudden downdrafts can occur, while options hedging has now dropped to neutral. Higher prices still likely.
2019.11 #5 Overall sentiment extremely low while options DM/SM & hedge ratio above neutral. Still expecting some type of pullback before run to top, Datamining a new var as SPX puts/ETF calls spread as options OI indicator.
2019.12 #1 Finally saw "mini flash crash" expected since late Oct, this should be a setup for the final run to the top. If match to early Mar 2015 (May top in 10 wks), using a 2x time frame this pts to a possible top around May 2020. Sentiment little changed for week as rebound was as swift as decline.
2019.12 #2 China trade agreement settled with SPX pushing over expt highs of 3100-50, still remain cautiously bullish. Sentiment similar to early Jan 2018. VIX puts shows too much betting on lower VIX while calls remain neutral.
2019.12 #3 Now turning cautiously bearish with Fri SPX close 3221, after bullish since Dec 2018 at 2350 as risk > reward. Factors are Dec opt exp high vol at 2x avg same as Sept 2018 plus extreme in Rydex bear/bull etf ratio and extreme lows in bearish sentiment.
2019.12 #4 SPX keeps chugging higher w/Fri close at 3240 and record lows in many bearish sentiment indicators. Crash indicator not at SELL, but as low as several temp pullbacks.

Saturday, February 16, 2019

No Problemas

Early Feb, I outlined what a continuation of a V-bottom rally similar to Oct-Dec 2014 would look like, giving a target for the primary impulse wave of SPX 2725-2825 based on a 3-4% shortfall of an eventual top ranging from 2800-2900.  The Oct 2014 primary wave ended when the Indicator Scoreboard and ST Indicator reached the SELL level.  Last week, the SPX at 2776 reached the midway pt of the target zone and the two main indicators also nearly at the SELL levels.  The SPX options OI is showing high levels of resistance at the 2700 area and above thru the EOM, so a two-three week pullback may start at any time.

Border wall with Mexico - no problem.  Trade war with China - no problem.  Let's party like it's 1999.

This week, in the Tech Indicator/Other section, I will take a closer look at the SPX ETF Indicator, comparing 2019 to 2014 when the "smart" money was not so smart.

I. Sentiment Indicators

The overall Indicator Scoreboard (INT term, outlook two to four months) bearish sentiment dropped sharply last week, now nearing the levels of the mid June 2018 top.  We may be within 2-3 days of a top then drop 3-5%.


The INT view of the Short Term Indicator (VXX+VXXB $ volume and Smart Beta P/C, outlook two to four months) bearish sentiment is also near the levels of the mid June 2018 top.


Bond sentiment (TNX) is still looking like the Jun-Sep 2018 period where a three month consolidation was seen before a sharp runup in rates.


For the INT outlook with LT still negative, the gold miners (HUI) bearish sentiment remains at low levels.


While looking at the ST, it is still topping.


II. Dumb Money/Smart Money Indicators

The Risk Aversion/Risk Preference Indicator (SPX 2x ETF sentiment/NDX ETF sentiment, outlook 2 to 4 mns/wks) as a INT indicator seems to have made a rounded bottom similar to Sep-Oct of 2018 that could indicate a significant top is near.


The option-based Dumb Money/Smart Money Indicator as short/INT term (outlook 2 to 4 mns/weeks) remains at moderately low bearish levels, but this indicator did not perform well off the Oct 2014 lows.


While the options Hedge Ratio that proved more accurate off the Oct 2014 bottom is nearing bearish levels similar to the Jun 2018 top.


The INT term SPX Long Term/Short Term ETFs (outlook two to four weeks) bearish sentiment remains in an unusual pattern due to neutral smart money and low bearish levels for dumb money.  More in Tech/Other section.


Long term neutral, the INT term NDX Long Term/Short Term ETF Indicator (outlook two to four weeks) as the long cycle seems to follow prices, the short cycle has remained at low levels that may indicate a Dec 2014 top is near as shown in the 2014 chart.


Surprisingly, the 2014 NDX Long Term/Short Term ETF Indicator worked much better than in 2018, much like the SPX ETF Indicator in 2018.  Nov 2014 sentiment is similar to Feb 2019.


III. Options Open Interest

Using Thurs close, remember that further out time frames are more likely to change over time.  This week I will look out thru Feb 28.

With Fri close at SPX 2776, Tue shows falling call resistance over 2775 and is unlikely to effect prices while over 2725.  May see higher prices.  Light open int overall.


Wed, little put support until SPX 2665, where the calls at 2750 and 2775 are likely to be critical.  A close at or below 2775 is possible.


Fri has large option OI and a decline down to SPX 2725 or even 2700 seems probable.


For Feb EOM, the open int is very large and the puts at SPX 2725 and 2750 may provide some support.  The 2710 calls seem critical due to hedging while prices remain higher, but below there is little put support until 2675 and 2650.  A gap fill at 2640 is possible.


IV. Technical / Other

An interesting article on ZeroHedge last week, pointed out that professional investors have been underweight equities since the Dec 2018 lows.  This prompted me to compare the current SPX ETF Dumb Money/Smart Money Indicator to 2014.  The conclusion was that in both periods "smart" money underperformed, probably due to the fact that market performance was driven by sentiment, not fundamentals.

For 2014, SPX ETF Dumb Money/Smart Money Indicator showed a strong BUY at the Sept 2018 top, but as seen below with the 2x and 3x ETFs, this was simply an artifact of stronger buying at the top by the "smart" money.  In 2019, we are now seeing the reverse.


Looking at 2014 "dumb" money (2x) showed weak bearish levels the last half of 2014.


Looking at 2014 "smart" money (3x) was even less bearish.


Comparing 2014 "dumb" money (2x) to today, we see moderate buying (low bearish levels).


Comparing  2014 "smart" money (3x) to today, sentiment is neutral.


Conclusions.  Given the parameters previously outlined for the V-bottom rally as seen in Oct-Dec 2014, the SPX at 2776 is nearing the large initial thrust target.  Prices may see some follow thru for a couple of days to the 2800-25 area.  A comparable 38% retracement from SPX 2350, comparable to Dec 2014, would target 2640-50 and may happen in the next two to three weeks.

Weekly Trade Alert.  A ST high in the SPX is expected by Wed in the 2800+ area that could drop down to 2700 or lower by EOM and may ultimately make a 38% retracement from the Dec lows.  Updates @mrktsignals.

Investment DiaryIndicator Primer,  update 2018.03.28  Dumb Money/Smart Money Indicators
Article Index 2018 by Topic
Article Index 2017 by Topic
Article Index 2016 by Topic
Long term forecasts

© 2019 SentimentSignals.blogspot.com

Saturday, February 9, 2019

What, No More Happy Talk?

Everyone seems to be surprised by the ferocity of the stock markets advance since the late Dec lows, but as I pointed out at the time, sentiment was consistent with a SPX 400+ pt rally, however, the advance has been like watching a Star Trek ship in warp drive.  The goal is obviously is to convince those expecting a 40-50% decline in Dec (dumb money), like 2001-02 and 2007-08, that we are now heading to DJIA 30K+ and sentiment (dumb money) is supporting that view.

One notable weakness is the narrowness of the advance, which I pointed out would be shown with the DJIA leading the way (PPT support) while the broader averages (SPX) lags.  One surprise Mon/Tue was strength in the NDX, but this was caused by only a handful of stocks (AAPL) and faded quickly as the week progressed.  Friday the DJIA did catch up to the downside.

I am not sure how many noticed the change in the GOPs approach to upcoming China trade talks, but for the past six months we have seen a pattern of "happy talk" via Trump tweets and other pre-announcements which ended getting investors excited, thereby bidding up prices, only to find prices crashing down even further after post-announcement realities.  Last Thur's AM pre-announcement that things weren't going so well put a damper on the unstoppable rally, but may actually reduce overall volatility going forward.  I expect March to come and go with no material change in China trade talks, but no action on additional tariffs is likely to let the market limp forward for a few months.


I. Sentiment Indicators

The overall Indicator Scoreboard (INT term, outlook two to four months) bearish sentiment is still following a similar pattern to May 2018 where a two week consolidation/pullback was seen between SPX 2700-50.


The INT view of the Short Term Indicator (VXX+VXXB $ volume and Smart Beta P/C, outlook two to four months) bearish sentiment is also following a similar pattern to May 2018.


Bond sentiment (TNX) is still looking like the Jun-Sep 2018 period where a three month consolidation was seen before a sharp runup in rates.


For the INT outlook with LT still negative, the gold miners (HUI) bearish sentiment remains near the lower extreme.


Looking at the ST gold miners (HUI) bearish sentiment from the last half of 2018 shows that the miners have been following the ST trend that appears to be topping.


II. Dumb Money/Smart Money Indicators

The Risk Aversion/Risk Preference Indicator (SPX 2x ETF sentiment/NDX ETF sentiment, outlook 2 to 4 days/wks) as a INT indicator is showing very strong preference for the risky NDX that was last seen in Aug 2018.  This may be indicating a late stage of the advance.


The option-based Dumb Money/Smart Money Indicator as short/INT term (outlook 2 to 4 days/weeks) is also following a similar pattern to May 2018.


The INT term SPX Long Term/Short Term ETFs (outlook two to four weeks) bearish sentiment has reached an extreme low level first on Wed when strong buying by dumb money (2x) was matched with neutral smart money (3x) and again on Thur when dumb money was weak sellers and smart money was strong sellers.  Since neither is at a SELL level, I am considering this as more of an anomaly.


Long term neutral, the INT term NDX Long Term/Short Term ETF Indicator (outlook two to four weeks) as the long cycle seems to follow prices, the short cycle has bounced back from the low bearish levels.


III. Options Open Interest

Using Thurs close, remember that further out time frames are more likely to change over time.  This week I will look out thru Feb optn exp.  I've noticed the past week that very ST put positions have been added one/two days before expirations (see Twitter updates), so there is a greater than usual chance that new put support will be added.

With Fri close at SPX 2708, Mon, if SPX falls below 2700, the next put support level is 2670, but there is very little call resistance until 2750.  Light open int overall.


Wed, if SPX is over 2700, put support could push prices to 2730 with little call resistance until 2750.  Below 2700 and 2660 is next support.  Light open int overall.


Fri, optn exp, SPX AM is potentially more bearish with call resistance at SPX 2700 and higher.  Large put and call positions at 2650 may cause that level to act as a magnet with strong put support at 2600.  Large open int overall.


Fri, optn exp, SPX PM is also bearish with 2670-75 likely an attraction area with put support at 2625 and call resistance at 2775.  Light open int overall.


Conclusions.  I had been expecting a tradeable top next week with a standard 38% retrace comparable to the Dec 2014 decline of 42% into late Feb 2019, but the ETF DM/SM indicators are suggesting that the remainder of the rally may be more like Jul-Oct 2018 with only 2-3% pullbacks and a top sooner than expected.  Trying to reconcile this with the macro picture, it's likely March will prove to be a standoff on China trade with a timeline extension and no new tariffs that may be viewed positively with Fed pausing rate hikes.  This may push the SPX 100-150 pts higher by summer.

Weekly Trade Alert.  With most of the sentiment similar to the May 2018 time period, a closer look at the SPX 2018 price levels shows a two week consolidation/pullback that is consistent with a slightly higher high (2740+) next week Tue/Wed followed by a somewhat stronger pullback (2650ish) into early the following week. Updates @mrktsignals.

Investment DiaryIndicator Primer,  update 2018.03.28  Dumb Money/Smart Money Indicators
Article Index 2018 by Topic
Article Index 2017 by Topic
Article Index 2016 by Topic
Long term forecasts

© 2019 SentimentSignals.blogspot.com