
About 78% of the entire Aug decline has been retraced the last two weeks, but bearish sentiment remains high, so much farther in time (months) or price is expected for the rally. As posted on Twitter early Wed AM, the LT (20 day) SPX P/C has reached the highest level of the last two years, surpassing both the Feb and Dec 2018 SPX lows.
The late 2014-15 analog shown on Aug 19 continues to track nicely with a sharp rally off of a triple bottom as seen in Jan 2015, but the timeline has accelerated from the 2X to 1X that could mean an earlier top than expected. This could be 4-8 months from now, or sometime the first half of 2020. More in Tech/Other.
I. Sentiment Indicators
The overall Indicator Scoreboard (INT term, outlook two to four months) bearish sentiment has fallen to a similar level to the first thrust off the early June lows to the SPX 2875-2900 area. This ended up being about 50% of the entire rally, and a similar percent this time would result in a rally to the SPX 3100-50 area.

The INT view of the Short Term Indicator (VXX $ volume and Smart Beta P/C [ETF Puts/Equity Calls], outlook two to four months) bearish sentiment is also a a similar level to the June rally to 2875-2900.

Bonds (TNX). Interest rates seem to be leveling off as bearish sentiment remains very low.

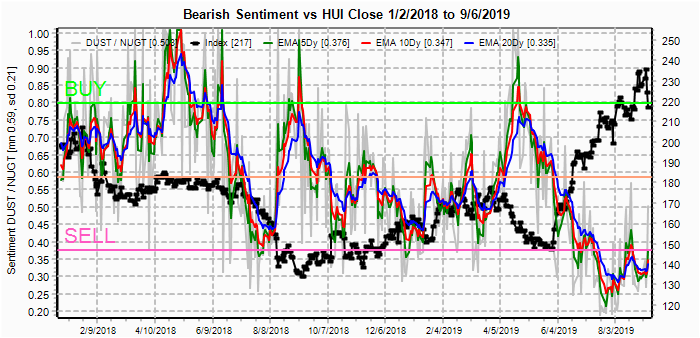
For the INT outlook with LT still negative, the gold miners (HUI) bearish sentiment remains extremely low even with the 8% drop in HUI late last week.
II. Dumb Money/Smart Money Indicators
For this week and possibly for the next several months, I am going to replace the DM/SM ETF indicators with other indicators.
The option-based Dumb Money/Smart Money Indicator as short/INT term (outlook 2 to 4 mns/weeks) bearish sentiment saw a sharp drop similar to the early June rally, but the LT (blue) will likely take several months to reach a SELL level..

And the sister options Hedge Ratio sentiment is still lagging, now at a level similar to late July 2018. A continued drop that meets or exceeds that of Jan, Sept-Oct or Dec of 2018 or May 2019 would be the first warning of a possible bear market.

The INT term SPX Long Term (2x/DM) ETFs (outlook two to four weeks) bearish sentiment rose to a higher level than seen during the May decline, so more prolonged rally is expected. With EW, normally W1 > W3 > W5 in price, so that with W3 300 pts, W5 should be < 3125 unless extended, but time may alternate so s short W3 may mean a long W5.

The INT term NDX Long Term (2x/DM) ETFs (outlook two to four weeks) bearish sentiment is somewhat lower than the SPX 2x ETFs, so some under performance is expected.

III. Options Open Interest
Using Wed close, remember that further out time frames are more likely to change over time, and that closing prices are more likely to be effected. This week I will look out thru Sept 13. Also, This week includes a look at the GDX for Sept 20.
With Fri close at SPX 2979, the rally carried over the call resistance levels of last week with current resistance levels at 2975 and 3000. A move below 2975 could drop to 2950 and a move higher should stop between 2995 and 3000. Light OI overall.

Wed OI is very light with resistance levels scattered between 2960 and 3010.

For Fri, OI levels show strong call resistance levels at 2980 and 3000, a move down to 2950 is expected sometime during the week, but could bounce back toward 2980.

Using the GDX as a gold miner proxy, For Sept exp with Fri close at 28.5 after reaching a high near 31 on Wed, GDX fell to the first line of weak put support. There is only moderate put support at 25 and almost no support below that level. 26 to 29 is the most likely range.

IV. Technical / Other
This week I will take a micro-look at two of the technical indicators, the NYAD and NYUD with 5 day SMAs. The NYSE NYAD had been improving with each of the three tests of the SPX 2825 area which pointed to a strong reversal in that area the end of Aug. Comparing declines over the last two years, however, the closest analog is Apr 2018 where a stair-step improvement hinted at a more prolonged choppy rally rather than the impulses off the Dec 2018 and May 2019 lows.

For the NYSE NYUD, the volume support was much weaker than off the Dec 2018 and May 2019 lows, now reaching levels lower than Apr 2018. This is more indicative of a short covering rally that may limited in price support and is likely to be choppy as in Apr-Oct 2018.

Conclusions. As discussed since early Aug a minor correction similar to Jan 2015 was expected that showed a "fake" breakdown from a so called "ending diagonal". The late 2014-15 analog has held up much better than expected with the most variation occurring in the timeline. The last twist to a faster timeline again brings questions as to when a May 2015 type top can be expected. Currently this appears to be 4-8 months from now. I don't really adhere to EW, but a top in the SPX 3100-50 area seems consistent with a 5 wave rally from the Dec 2018 lows. This may be the "ultimate fake out" if a bear market ensues afterwards since any pullback should be corrective.
Weekly Trade Alert. Some consolidation, pullback next week seems likely to the SPX 2950 area. Oct could prove to be a volatile month with possible Brexit, China trade talks and Fed uncertainty on the line. Mar 2015 saw a 50% pullback from the rally off the Jan lows, so if the analog continues to hold, a similar pullback from the next high is expected. Updates @mrktsignals.
Investment Diary, Indicator Primer, update 2019.04.27 Stock Buybacks, update 2018.03.28 Dumb Money/Smart Money Indicators
Article Index 2019 by Topic
Article Index 2018 by Topic
Article Index 2017 by Topic
Article Index 2016 by Topic
Long term forecasts
© 2019 SentimentSignals.blogspot.com
No comments:
Post a Comment