
Typically this type of funding shortage has preceded broader financial problems and prompted Martin Armstrong to predict that this is the result of negative interest rates world-wide, as banks see extremely low reward to risk for short term lending, and will be cause of the next financial crisis. This fits into my thesis that investors focused on China trade and actions by the Fed will not see the source of a stock market downturn. The ICMA Group discusses several aspects of repo rates and the effects of negative rates if anyone wants more info.
Last week showed more strength than expected with only a brief "sell the news" reaction to the FOMC actions, but did succumb in the last couple of hours Friday to the high level of bullishness in the options OI.
I. Sentiment Indicators
The overall Indicator Scoreboard (INT term, outlook two to four months) bearish sentiment saw a brief sharp drop before bouncing late in the week and may be repeating the stair step decline seen from Jun-Oct 2018 and Mar-Apr 2019.

The INT view of the Short Term Indicator (VXX $ volume and Smart Beta P/C [ETF Puts/Equity Calls], outlook two to four months) bearish sentiment has fallen more slowly and seems to be following the Jun-Oct 2018 pattern.

Bonds (TNX). Interest rates have consolidated off their recent lows as bearish sentiment remains very low.

For the INT outlook with LT still negative, the gold miners (HUI) bearish sentiment remains at extreme lows as prices consolidate.

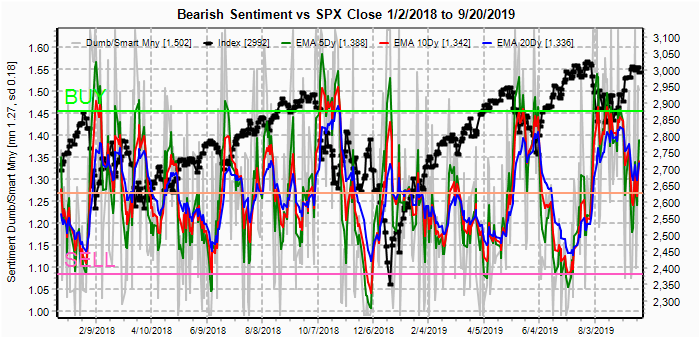
II. Dumb Money/Smart Money Indicators
For this week and possibly for the next several months, I am going to replace the DM/SM ETF indicators with other indicators.
The option-based Dumb Money/Smart Money Indicator as short/INT term (outlook 2 to 4 mns/weeks) bearish sentiment is similar to the ST Indicator and has not dropped much, also like the Jun-Oct period.
And the sister options Hedge Ratio sentiment did see a sharp drop and reversal and may support a larger rally when the ST EMA (gr) reaches a BUY.

The INT term SPX Long Term (2x/DM) ETFs (outlook two to four weeks) bearish sentiment has declined considerably, but nowhere near the point of a significant top.

The INT term NDX Long Term (2x/DM) ETFs (outlook two to four weeks) bearish sentiment has again fallen more than the SPX even though the NDX is a couple % below its high and may under perform .

III. Options Open Interest
Using Wed close, remember that further out time frames are more likely to change over time, and that closing prices are more likely to be effected. This week I will look out thru Sept 27. Also, This week includes a look at the GDX for Oct.
With Fri close at SPX 2992, we see a sharp reversal of opex OI as put support is likely to hold at 2975, while weak call resisiance and put support could push prices back to SPX 3010.

Wed, however, shows signs of an expected EOQ window dressing rally with large call OI at 3055, so likely a drop back below SPX 3000.

For Fri, continued pressure toward SPX 2975 looks likely although early week weakness could increase put support where a 3000 close is possible.

Looking out to the Oct exp for SPY (1/10 SPX), call resistance is likely to keep prices below SPX 3000, but the large put OI at 308 may lead to a rally well over SPX 3000 by mid-month.

Using the GDX as a gold miner proxy, currently 28.7. For Oct exp, rhe like;y range is 27-29.

IV. Technical / Other
It's probably time to revisit the 2015 analog again as last week's intra-day pullback followed the same general pattern with a couple weeks of higher prices before a 50% retracement of the previous rally.

While the longer term Rydex Bear/Bull ETF Ratio is in about the same position as the SPX 2x ETF ratio and implies several more months of uptrend before a significant top.

Conclusions. Last week was range bound between SPX 2875 and 3025 as the bullish OI positions did put some downward pressure on the SPX. Next week looks like more of the same. Given the recent chatter comparing Sept 2019 to Sept 2007 which preceded the Oct 2007 high, my preference is a delayed rally top into mid Oct. If this follows the 2015 analog, a sharp 50% retracement of the rally from the Aug lows will setup sentiment for a rally several months long.
Weekly Trade Alert. The next couple of weeks may be pretty boring, but by mid-Oct the SPX should reach a top in the 3040-50 area before a late Oct swoon down to the 2930-40 area. Updates @mrktsignals.
Investment Diary, Indicator Primer, update 2019.04.27 Stock Buybacks, update 2018.03.28 Dumb Money/Smart Money Indicators
Article Index 2019 by Topic
Article Index 2018 by Topic
Article Index 2017 by Topic
Article Index 2016 by Topic
Long term forecasts
© 2019 SentimentSignals.blogspot.com
No comments:
Post a Comment