
This raises an interesting conundrum for the Fed next week. Although a 25 BP cut in the Fed funds rates is likely already decided, more stimulus may also push longer rates higher. It's possible if an economic turn around appears by next summer, the Fed may be forced to raise rates to stop a bond market rout. Then wave adios to Trump.
Since the beginning of Sept, bonds (TLT) are down 8%, dropping almost twice as fast as they rose in Aug. It's interesting, however, that everyone thought the end of the world was coming when the SPX fell 7% in Aug, but judging by bond sentiment, bond holders seem to have shrugged off a similar drop in bonds.
In this week's Tech/Other section, I will take a closer look at the comparison of the NYUPV/NYDNV comparison between 2007-09 and today.
I. Sentiment Indicators
The overall Indicator Scoreboard (INT term, outlook two to four months) bearish sentiment saw a sharp drop last week and is consistent withe Jun 2018 and Mar 2019 where a 75 pt drop followed in the SPX.

The INT view of the Short Term Indicator (VXX $ volume and Smart Beta P/C [ETF Puts/Equity Calls], outlook two to four months) bearish sentiment has dropped somewhat more slowly, but is also not far from the levels seen in Jun 2018 and Mar 2019.

Bonds (TNX). Interest rates in Sept have risen about twice as fast as they fell in Aug, but bondholders seen not to have noticed as sentiment remains near low extremes. The first support level is at 2.1-2.2% which could be seen as early as next week.

For the INT outlook with LT still negative, the gold miners (HUI) continue to move inversely with interest rate levels and bearish sentiment remains at very low levels after a 15% correction.

II. Dumb Money/Smart Money Indicators
For this week and possibly for the next several months, I am going to replace the DM/SM ETF indicators with other indicators.
The option-based Dumb Money/Smart Money Indicator as short/INT term (outlook 2 to 4 mns/weeks) is lagging other sentiment indicators and appears to be setting up a repeat of the July-Oct 2018 period where skepticism proved to be correct thru the Oct decline, but the strong BTFD optimism for a year-end rally in Nov provided the sentiment backdrop for the Dec collapse. I am expecting a similar sentiment setup in 2020 on a somewhat larger scale, where an early year pullback sets up expectations for a strong BTFD for the presidential cycle rally into the election.
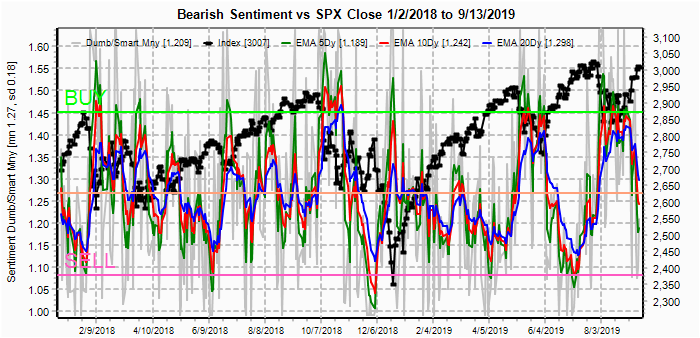
And the sister options Hedge Ratio sentiment is dropping very quickly and is likely to see the LT EMA (blue) drop to 1.05 before a significant pullback.

The INT term SPX Long Term (2x/DM) ETFs (outlook two to four weeks) bearish sentiment has fallen more slowly than the shorter term (options) sentiment and is consistent with several months more of upward bias..

The INT term NDX Long Term (2x/DM) ETFs (outlook two to four weeks) bearish sentiment has now caught up with the SPX ETF sentiment, so it may start to performing more closely to the SPX, but still faces lack of buyback support.

III. Options Open Interest
Using Wed close, remember that further out time frames are more likely to change over time, and that closing prices are more likely to be effected. This week I will look out thru Sept 20. Also, This week includes a look at the TLT for Sept.
Last weeks momentum was able to push the SPX over the 2980-3000 call resistance levels after the expected drop early in the week toward the 2950 area (2957). Sentiment this week looks like a repeat of the July FOMC week where a "sell the news" reaction was expected and resulted in a 50 pt drop in the SPX.
With Fri close at SPX 3007, the SPX is in a neutral pocket at 3005-10, but the higher level of calls at 3000 indicates a power struggle at that level.

Wed there is little support above 2990 and a drop to the 2990-3000 level is expected..

For Fri, things become very interesting. Due to the fact that most exp options for SPX are AM and mostly hedged, the OI for PMs are very light, but show a strong negative bias toward the 2950 level or lower.

As confirmation, I also looked at the SPY for Sept exp (price 1/10 SPX), but this also shows a strong negative bias towards SPX 2950. My conclusion is another "sell the news" event, whether the market is disappointed with a rate cut, or potentially gets "freaked out" if selling continues in the bond market as we saw after Thurs ECB rate cut.

Currently the TLT is 136.5 with the TNX at 1.9%. The TLT dropped through strong put support at 139 like a hot knife thru butter and the next significant support is at 128, so there is definitely room for continued turmoil in the bond market. TLT 128 is about TNX 2.1-2.2%.

IV. Technical / Other
A couple of weeks ago I mentioned that one of the LT indicators I look at, the NYUPV/NYDNV was following a similar pattern to 2006-07 and today I will take a closer look at that comparison. First for 2006-09, the green circles represent smart money buying, while the red circles are dumb money buying. Smart money were buying mid 2006 before the runup to ATH and heavy buyers at the late 2008 and early 2009 lows, while the dumb money were mostly BTFD buyers buying pullbacks most of the way down in late 2007 and early 2008.

In 2018 and 2019, we have seen similar patterns as the dumb money has consistently piled in at the tops while smart money scoops up bargains at the bottom. With 2020 an election year similar to 2008, I expect to see the same BTFD behavior by dumb money if there is a correction early 2020 based on the expectation of a strong rally for the presidential election.

Conclusions. Many of the people who were looking for SPX 2600-700 two weeks ago are now looking for the SPX to advance to 3100-50 over the next two weeks, but I am highly skeptical given their recent track record. The last quarter of 2017, I was comparing the SPX setup to 1999 where we had a sharp spike in bearish sentiment (ST Indicator vs LTCM crisis), but were facing rising TNX rates due to the Fed's ending QE. In 1999, as rates rose the SPX typically stalled, but then chugged forward when rates paused. We may see something similar today, but I am not expecting a "melt up" unless there is a trade agreement with China (probability < 40%). A trade agreement could push the SPX to 3200-300.
The highest probability is a continued upward bias thru the end of the year, although the 2015 warns of the probability of a 50% retrace from the Aug lows. If there is a "sell the news" following the FOMC that backtracks to SPX 2940-50, EOQ window dressing will likely push the SPX to 3025-50 by EOM, then an Oct retrace may begin. LT 2020 could be a very interesting year.
Weekly Trade Alert. M-W looks like the SPX will dance around 3000 according to options OI, but W-F will provide a negative bias toward the SPX gap at 2940 at least thru Fri. Updates @mrktsignals.
Investment Diary, Indicator Primer, update 2019.04.27 Stock Buybacks, update 2018.03.28 Dumb Money/Smart Money Indicators
Article Index 2019 by Topic
Article Index 2018 by Topic
Article Index 2017 by Topic
Article Index 2016 by Topic
Long term forecasts
© 2019 SentimentSignals.blogspot.com
No comments:
Post a Comment