
The outlook for the week was early strength followed by weakness using the options OI as the level of SPX call buying over 3000 was getting ridiculous. Tue AM rant against China's patent infringements at the UN by the POTUS was enough to turn the market sour, and later news that the Dems would start an impeachment process over the Ukraine/Trump conversations about Biden threw an anchor around the market. The result was testing lower OI support at 2950 (2945 act), but 2950 is starting to look a lot like 2825 in Aug.
Overall, the market seems to be led higher by the DJIA and lower by the NDX, supporting the influence of buybacks on the higher dividend paying stocks as pointed out a few weeks ago. With last weeks ETF sentiment for the NDX near a SELL, I suspected the 2015 analog might be in jeopardy and the upside target was missed by 1% on the SPX. Implications of DJIA leadership are discussed further in Tech/Other.
I. Sentiment Indicators
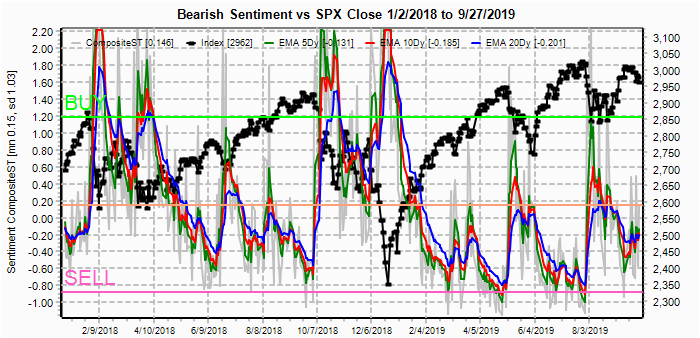
The overall Indicator Scoreboard (INT term, outlook two to four months) bearish sentiment has risen back to neutral after reaching a ST SELL a few days ago. The pattern continues to resemble Jul-Oct 2018 and Mar-Apr 2019.

The INT view of the Short Term Indicator (VXX $ volume and Smart Beta P/C [ETF Puts/Equity Calls], outlook two to four months) bearish sentiment has only improved slightly, also resembling Jul-Oct 2018 and Mar-Apr 2019.
Bonds (TNX). Interest rates moved lower, retracing about half the rise from early Sept as sentiment remains very low.

For the INT outlook with LT still negative, the gold miners (HUI) bearish sentiment remains near an INT SELL as prices may be forming a H&S top. Recent strength in the US$ due to somewhat positive economic news has put pressure on gold/stocks.

II. Dumb Money/Smart Money Indicators
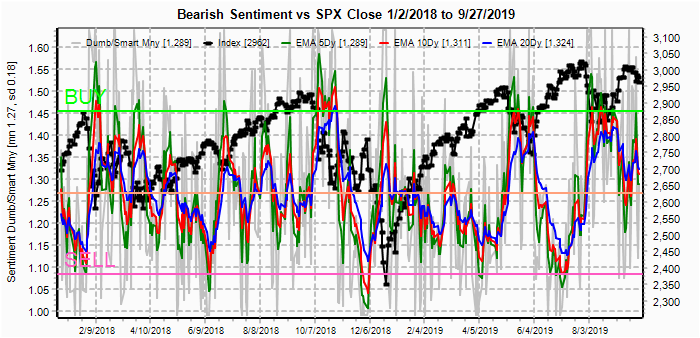
The option-based Dumb Money/Smart Money Indicator as short/INT term (outlook 2 to 4 mns/weeks) reached a near ST BUY last week and appears to be following the Aug-Oct 2018 pattern.
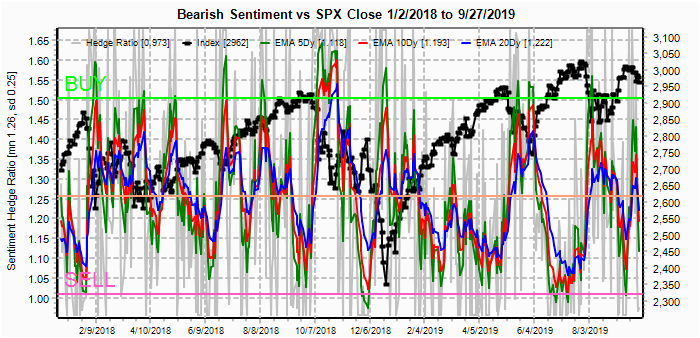
And the sister options Hedge Ratio sentiment is somewhat similar to the DM/SM indicator, but a sharp drop is warning that continued ST volatility is to be expected.
This week I noticed that the SPX related DM/SM ETF indicators seemed to be working better over the last year so I will switch back to covering them on a trial basis.
The Risk Aversion/Risk Preference Indicator (SPX 2x ETF sentiment/NDX ETF sentiment, outlook 2 to 4 mns/wks) as a INT indicator (pref to less risky SPX is bullish), has seen a rise similar to Oct 2018 and Aug 2019, indicating that the potential for a rally is building.

The INT term SPX Long Term/Short Term ETFs (outlook two to four wks/mns) bearish sentiment (2x DM/3x SM) has been gradually improving since June that may indicate a breakout from the SPX 2800-3025 is ahead, but similarities to Oct-Dec 2018 warn that a final flush lower is possible.

The INT term NDX Long Term (2x/DM) ETFs (outlook two to four weeks) bearish sentiment warned last week of potential weakness in the NDX and a retest of the 7500 area is possible before a turn around.

III. Options Open Interest
Using Wed close, remember that further out time frames are more likely to change over time, and that closing prices are more likely to be effected. This week I will look out thru Oct 4. Also, this week includes a look at the TLT for Oct exp.
With Fri close at SPX 2962, the SPX is right at strong put support at 2960, but only moderate support below until 2925. Weak call resistance starts at 2975 and strong call resistance is at 3000 and higher.
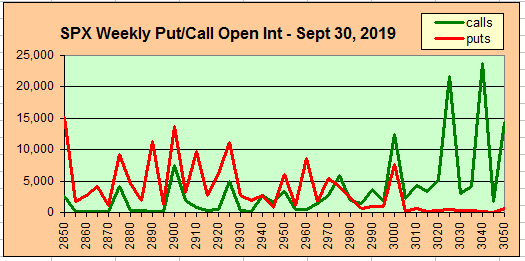
Wed is pretty much the same as Mon with put support at 2960 and similar call resistance.

For Fri, strong put support drops to 2950, but due to overlap there is little call resistance until 3000, so a wider range is possible.

Due to the trade talks with China scheduled for Oct 10-11, I thought I would also add a look at the following Fri, where the outlook is similar with put support at 2950, call resistance moves up to 3010, and overlapping puts/calls in between leave only slight downward bias.

Currently the TLT is 142.7 with the TNX at 1.67%. There is very strong put support at 139 with almost no call resistance up to 150. This comes as a complete surprise, but with the various risks to the stock market that are emerging, everyone seems to feel that rates will rise. My outlook is that rates will hold steady or fall, probably thru mid-2020. If Dems succeed in ousting Trump, spending policies will likely trip the bond market.

IV. Technical / Other
Since the relative strength of the DJIA to SPX/NDX favored by the buyback spread (Div/TNX) seems to be consistent and getting stronger, I wanted to look back over the last couple of years to see what this has meant. As you can see from the chart below, the $INDU/$SPX ratio is mid-range for the last two years and rising. Notably the last two peaks were Jan/Feb and Nov/Dec 2018. Both Jan and Oct 2018 saw the ratio rise to 9.3 before an INT top, while initial downturns saw spikes to the 9.6 level. Apparently, more money flows into the largest and most liquid stocks (DJIA/INDU) as the top approaches and risk increases. We are not there yet.

Conclusions. Trade talk, the economy, the Fed and now impeachment. The stage of possible candidates for an INT correction or more keeps increasing, but no immediate catalyst is in sight. What seems to make most sense now is for a continued media circus similar to what we saw in 1998-99 with the Clinton/Lewinsky affair when the POTUS was accused of lying under oath about getting a BJ in the WH. With the Reps firmly in control of the Senate, conviction seems like a remote possibility, but similar to Clinton, the daily airing of dirty laundry between now and the 2020 elections can swing things in favor of the Dems.
A Dem win for POTUS and/or Senate is likely to swing things in favor of those that spend (middle class/elderly) and away from those that invest (1%) with strong negative implications for the stock market. The potential should be clear by mid-2020 which fits in my expected timeline. Longer term, stronger consumer spending and a move back to global cooperation, instead of isolationism, is likely to restore growth that may provide the impetus for a final blow off.
Weekly Trade Alert. Bearish sentiment shows a balance between bulls and bears that is likely to result in a ST trading range of roughly SPX 2950-3000, but the INT term sentiment is building for a rally. SPX 3100-50 by mid-2020 still doable. Updates @mrktsignals.
Investment Diary, Indicator Primer, update 2019.04.27 Stock Buybacks, update 2018.03.28 Dumb Money/Smart Money Indicators
Article Index 2019 by Topic
Article Index 2018 by Topic
Article Index 2017 by Topic
Article Index 2016 by Topic
Long term forecasts
© 2019 SentimentSignals.blogspot.com
No comments:
Post a Comment