Trumps warning about an epic stock market crash if he is defeated in the 2020 elections may turn out to be a self fulfilling prophecy as it has only added to investors fear and as the stock market crashes, so does his chances of re-election.
Although my LT indicators have been warning about a downturn greater than that of Oct-Dec 2018 for several months, I missed the top since the ST indicators were not clear. The same thing happened in Oct 2018, but by Dec 2018 the ST indicators did identify the final crash wave. There are also a lot of similarities both sentiment-wise and price-wise to the Oct 2018 downturn and these are covered in the Tech/Other section. In my defense, Avi G. as late as Tue called for a bottom at SPX 3150 with projections for 3700 by Fall.
The one "seer" that did correctly ID this downturn was Raj at Time and Cycles, although he had several earlier calls that did not pan out. Trader Joe has also been warning of a sharp downturn, both ST and LT, as he sees the rally from Mar 2009 as complete as wave 5 of (5) of Cycle V which could mean the beginning of a major bear market. This supports my outlook for a 30-40% decline.
I. Sentiment Indicators
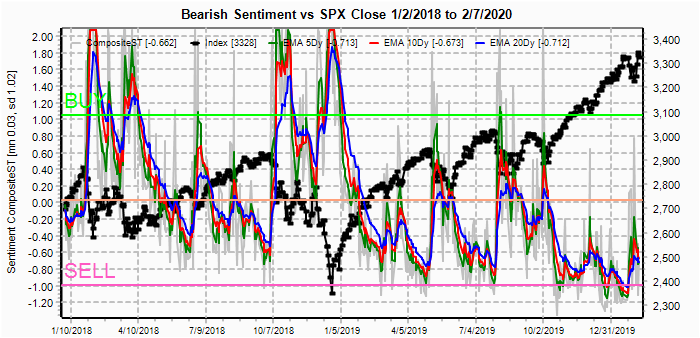
The overall Indicator Scoreboard (INT term, outlook two to four months) bearish sentiment saw a sharp jump last week but is less than the first leg down in Feb 2018 and about the same as the first leg down in Oct 2018. Not supportive of a strong bounce at this time.

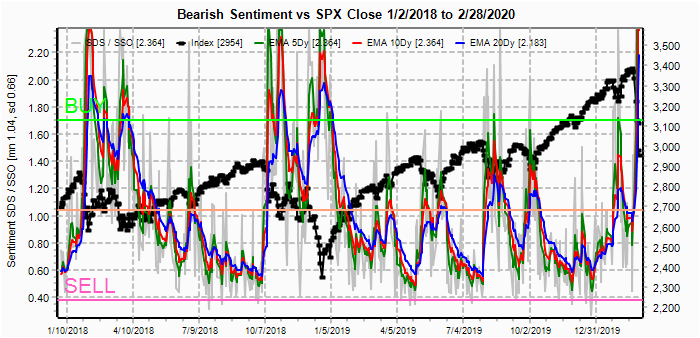
The INT view of the Short Term Indicator (VXX $ volume and Smart Beta P/C [ETF Puts/Equity Calls], outlook two to four months) bearish sentiment saw an even weaker jump with the LT EMA only at neutral. Expect more volatility.

Bonds (TNX). Interest rates continue their downward trend even with sentiment at record lows. Bonds may continue their strength into the election, but as we saw last week from stocks and gold, reversals can be swift and strong when bearish sentiment is this low.

For the INT outlook with LT still negative, the gold miners (HUI) extreme low bearish sentiment may have caught up with the HUI last week and at one pt was down 10% on Fri alone. Apparently China has begun liquidating some of its gold hoard to help bail out its faltering economy and with Russia and China CBs the largest buyers of gold over the last several years, weakness may persist until China's economy recovers.

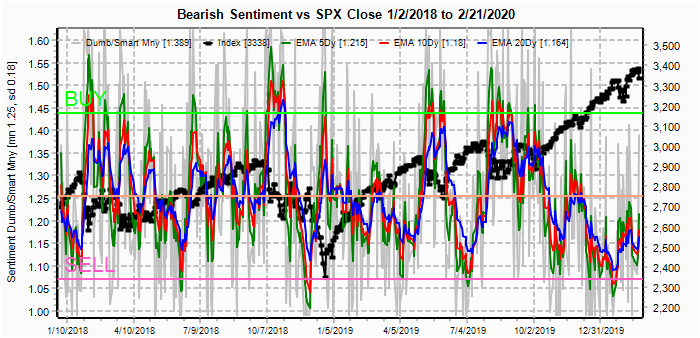
II. Dumb Money/Smart Money Indicators
The option-based Dumb Money/Smart Money Indicator as short/INT term (outlook 2 to 4 mns/weeks) remains surprisingly weak, perhaps due to hopes of Fed intervention, but sentiment remains well below that need to support even a strong bear market rally.

And the sister options Hedge Ratio sentiment is weaker still, so more downside is expected.

Unlike the ST options indicators, the INT term 2x ETF indicators have reached high levels of bearishness, possibly indicating that a ST washout will result in an INT rally. The INT term SPX Long Term (2x/DM) ETFs (outlook two to four weeks) bearish sentiment has reached levels seen at the Feb and Oct 2018 lows, but does not rule out a retest (Feb-Mar) or washout (Oct-Dec).
The INT term NDX Long Term (2x/DM) ETFs (outlook two to four weeks) bearish sentiment has risen sharply and most resembles that of Oct 2018.

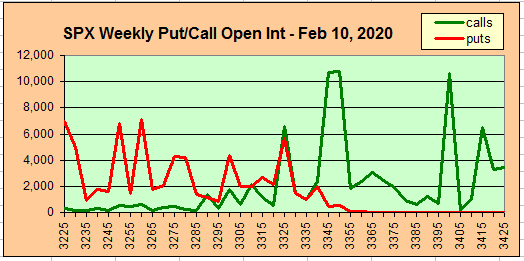
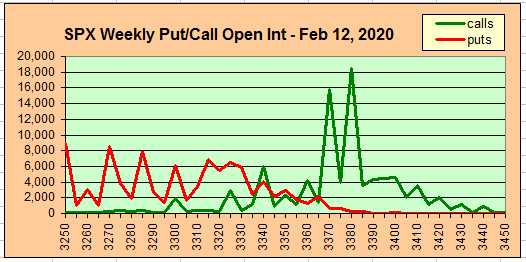
III. Options Open Interest
Due to the extreme trading range of 500 pts last week in the PX, I don't think the options OI will be very useful, so more charts are covered in Tech/Other.
Using the GDX as a gold miner proxy closing at 26.2 dropping sharply for the week from 30.4, whipsawing from above call resistance at 30 to below put support at 27. Corrected chart here.
Currently the TLT is 155 with the TNX at 1.13%. TLT is in positive delta hedging with little put support, but also lower call resistance. May continue higher, but with possible whipsaw potential.

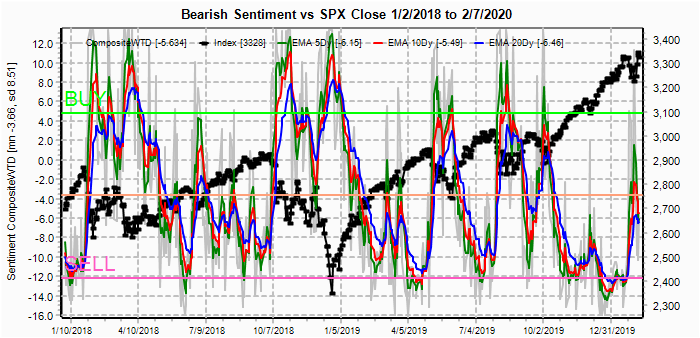
IV. Technical / Other
The regular indicators (WTD & ST Comp) show that bearish sentiment has only reached the level seen on the first leg down in Oct 2018, while SPX and NDX 2x ETFs show stronger bearish sentiment. Let's look at a couple of other indicators. First the Crash Indicator. Here you can see that only a weak SELL was given, about the same as the Sept 2018 top, and now has only risen to the neutral level weaker than the first leg down in Oct 2018.

Next a public indicator I have used several times, the Rydex Bear/Bull ETF ratio. Here you can see the ST SELL level was weaker than seen in late Dec, but the rise in bearish sentiment has also been weak, again matching the first leg down of the Oct 2018 decline.

Next, I will look at price considerations. First a look at the entire "Trump rally" from 2016. There have been several attempts to break above the top TL with violent retracements each time. There seems to be an alternating pattern where several tests of the upper TL as in Apr-Oct 2018 and May-Oct 2019 are followed by breakouts that collapse. Late 2018 saw a retracement all the way to the lower TL. This seems likely again with the lower TL near SPX 2600.

Looking back at Oct 2018 the SPX retraced four months of gains in a little over a week.

In 2020, the SPX also retraced four months of gains in a little over a week.

Finally looking more closely at the Oct-Dec decline. The first leg down was 230 pts from 2940 to 2710, then a 46.5% retrace to 2817 and finally a second leg down of 213 pts or 92.6% of w1 to 2604. After several weeks of consolidation (flat), the Dec decline started at 2800 and fell 135% of the entire Oct decline from 2940 to 2604. Applying the same % to the Feb 2020 leg down from 3393 to 2855 gives a retrace to 3105 to fill the gap then a second leg down to 2608. With SPX and NDX ETF sentiment as strong as it is, a consolidation could last most of the summer, but Fall could see a Dec-like decline with the return of the flu season and covid-19 scare 2 and election uncertainty. A similar decline to Dec 2018 from 3100 would target 2040s using the 135% extension from 3393 to 2608

Conclusions. Many still seem to believe in the omnipotence of the worlds CBs, but seem to have forgotten that $600B combined repo bailout mid-Feb with the US and China only elevated markets for a couple of days, this following the fastest expansion of the Fed's balance sheet in history. As some have pointed out, the problem is not from lack of demand that can be controlled by the Fed, but lack of supply going forward. I have outlined my prognosis under Tech/Other as the Oct-Dec 2018 analog seems to be the most likely path going forward. The first level to look for a strong bear market rally is the SPX 2600 level likely to be seen in Apr-May when forward guidance for earnings is likely to shown a 20-30% reduction from 2019. After that the summer may see a relief rally with flu symptoms in remission, but recent info that show that Covid-19 can lie dormant for weeks if not months almost guarantees round two in the Fall. If SPX 3100 is not taken out with authority by then, much lower levels may be seen in the Fall.
Weekly Trade Alert. Don't try to catch a falling knife. The US seems to just be getting started with reported covid-19 cases with more reported this weekend on the West coast. There may be a short relief rally to about SPX 3100 with hopes that the Fed can conquer all, but no strong support is likely until 2600. SPX 3100, if reached, may be another oppty to short with another 500 pt decline possible. Updates @mrktsignals.
Investment Diary, Indicator Primer,
update 2020.02.07 Data Mining Indicators,
update 2019.04.27 Stock Buybacks,
update 2018.03.28 Dumb Money/Smart Money Indicators
Article Index 2019 by Topic, completed thru EOY 2020.02.04
Article Index 2018 by Topic
Article Index 2017 by Topic
Article Index 2016 by Topic
Long term forecasts
© 2020 SentimentSignals.blogspot.com