
Mario Draghi gave warning that the world's CBs were not going to be as accommodating as the markets expected last Monday when he said the EU would not lower rates in July, and I very seriously doubt the Fed will be any different, especially since the US economy is twice as strong as the EU based on GDP growth and unemployment. For the markets, this raises serious doubts about the melt up scenario and increases the possibility of a 2015-type distribution top that could last into the end of the year.
In the Tech/Other section I will compare the performance of two of the top indicators for the 2015 period. The results may surprise you. For the current market, the SPX certainly looked like a melt up was starting this week, as the SPX "close to 3000" target was hit in three days rather than the three week outlook and now it looks like a small pullback is in progress. If the 2015 distribution top is in play, a 3 to 5% pullback is possible with SPX 3000 replacing the 2100 barrier for 2015.
I. Sentiment Indicators
The overall Indicator Scoreboard (INT term, outlook two to four months) bearish sentiment fell sharply last week to levels that preceded consolidations/pullbacks since mid 2017..

The INT view of the Short Term Indicator (VXX+VXXB $ volume and Smart Beta P/C [ETF Puts/Equity Calls], outlook two to four months) bearish sentiment did not quite reach the levels seen at the Apr 2019 top, and may allow for a final melt up as seen in Dec 2017 or a more immediate correction.

Bonds (TNX). Interest rates may have bottomed with Friday's sharp reversal. If "green shoots" continue to appear a rise in rates should support stocks for the INT term as some bondholders move back into stocks.

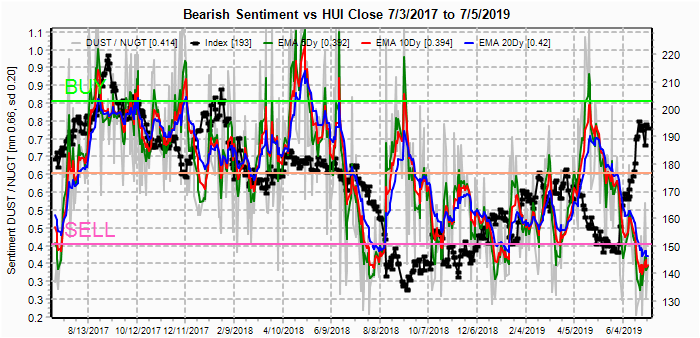
For the INT outlook with LT still negative, the gold miners (HUI) extreme bearish sentiment lows also coincided with a sharp price reversal. A less dovish Fed may show that the near vertical rally was a false signal.
II. Dumb Money/Smart Money Indicators
For this week and possibly for the next several months, I am going to replace the DM/SM ETF indicators with other indicators.
The option-based Dumb Money/Smart Money Indicator as short/INT term (outlook 2 to 4 mns/weeks) remains low similar to the Dec 2017 and June 2018 periods.

And the sister options Hedge Ratio sentiment is also at the levels of its most recent extremes.

The INT term SPX Long Term (2x/DM) ETFs (outlook two to four weeks) bearish sentiment has also reached a level seen near recent tops except for the late 2017 period.

The INT term NDX Long Term (2x/DM) ETFs (outlook two to four weeks) bearish sentiment also fell sharply last week with the NDX approaching 8000 and may indicate something like the June 2018 top.

Finally, I also wanted to mention two other sectors, first the small caps (RUT, no chart) which is lagging the SPX and is probably an indication that buybacks, not growth, are supporting the markets. Second, the banking sector (BKX) that is severely lagging and appears to be in a LT downtrend. This sector topped about 6 weeks before the SPX in Sep 2018 after a similar SELL signal, although the Dec 2017 SELL was premature.

III. Options Open Interest
Using Wed close, remember that further out time frames are more likely to change over time, and that closing prices are more likely to be effected. This week I will look out thru Jul 12. This week includes a look at the TLT for Jul 19.
With Fri close at SPX 2990 and moderate open int, there is strong call resistance at 3000 and no put support until 2945. Call hedging may provide some support above 2975.

Wed with light open int, calls may again pressure the SPX toward 2975, but a strong up move could reach 3020.

For Fri large open int is likely to show downward pressure for the week. The SPX is likely to close between 2950-75.

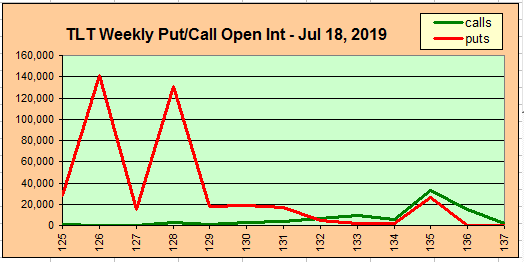
The TLT 20 year bond fund is used as a proxy for interest rates. Currently the TLT is 132.4 with the TNX at 2.05%. There is some put support at 132 with very strong support at 128, some pullback is likely.
IV. Technical / Other
Last week I used a data mining chart to show the Smart Beta P/C components of Equity calls and ETF puts indicated that an SPX melt up may be needed to give a similar topping signal as Jan and Oct 2018, but this week I want to focus on the possibility of a distribution top as seen in 2015. Looking back at mid 2014 to EOY 2015 using the same indicator, there was no final surge in equity call buying, and instead, there was an extended period of indifference with less and less options speculation.

As a result the Smart Beta P/C was less effective the first half of 2015.

However, the DM/SM options indicator continued to perform well over the entire period. It's still too early to tell whether this time will see the melt up or distribution top, but the 2015 scenario fits better into my preference of 2020 being a high risk period.

Conclusions. Upside targets were reached with an early week fireworks display by the SPX, but may be followed by an after party hangover. I still have not given up on the 2015-type distribution top that could last thru the end of year. If so, investors are likely to view 2020 as a sure thing just like Nov-Dec 2018. After all, seasonality made late 2018 seem "safe", and the 2020 US elections are likely to be viewed the same.
The likely requirements for this scenario are a slowly improving economy with hope for rate cuts and hope for a China trade agreement keeping the SPX in a fairly tight range of 2850-3050.
Weekly Trade Alert. Extremely low bearish sentiment will likely start a 3-5% correction (SPX 2850-2900). Updates @mrktsignals.
Investment Diary, Indicator Primer, update 2019.04.27 Stock Buybacks, update 2018.03.28 Dumb Money/Smart Money Indicators
Article Index 2019 by Topic
Article Index 2018 by Topic
Article Index 2017 by Topic
Article Index 2016 by Topic
Long term forecasts
© 2019 SentimentSignals.blogspot.com
No comments:
Post a Comment