
I. Sentiment Indicators
The overall Indicator Scoreboard (INT term, outlook two to four months) bearish sentiment continues to fall sharply as stocks appear to enter a melt up phase.

The INT view of the Short Term Indicator (VXX+VXXB $ volume and Smart Beta P/C [ETF Puts/Equity Calls], outlook two to four months) bearish sentiment has also reached its second lowest level compared to the Apr 2019 SPX top.

Bonds (TNX). Interest rates appear to be bottoming with very low sentiment. The CPI core inflation level rose over the Fed's 2% target with corn (up 12%) leading the way.

For the INT outlook with LT still negative, the gold miners (HUI) bearish sentiment remains extremely low, but Trump's talk of lowering the US $ has added strength to golds demand.

II. Dumb Money/Smart Money Indicators
For this week and possibly for the next several months, I am going to replace the DM/SM ETF indicators with other indicators.
The option-based Dumb Money/Smart Money Indicator as short/INT term (outlook 2 to 4 mns/weeks) has now reached a comparable level to mid-Dec 2017. Combined with the Hedge Ratio, below, it seems like some type of pullback is likely to raise bearish sentiment to neutral before the final melt up phase.

And the sister options Hedge Ratio sentiment is showing an extremely low level of hedging that is likely to lead to a pause/pullback.

The INT term SPX Long Term (2x/DM) ETFs (outlook two to four weeks/mns) bearish sentiment is declining more slowly, indicating that a final top is not likely.

The INT term NDX Long Term (2x/DM) ETFs (outlook two to four weeks/mns) bearish sentiment has fallen more sharply than the SPX ETFs and may lead to relative weakness.

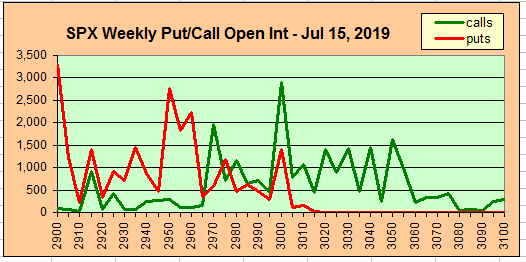
III. Options Open Interest
Using Wed close, remember that further out time frames are more likely to change over time, and that closing prices are more likely to be effected. This week I will look out thru Jul 19. Also, This week includes a look at the GDX.
With Fri close at SPX 3014, put/call open int is much like last week and should prices toward the 2950 level, but may continue to be ineffective in a strong market.
Wed is same as Mon, but a hold over SPX 3000 could push to 3040.

For Fri, I'm looking at the SPY as the monthly PMs have higher open int, but the conclusions are pretty much the same as calls should push prices below SPX 3000, but delta hedging over 3000 could push prices toward 3050.

Using the GDX as a gold miner proxy. now 26.20. For Apr exp, strongest resistance is at 26, so above that there is little resistance.

IV. Technical / Other
Looking at the Smart Beat P/C components, the ETF put levels reached the levels seen at several prior tops, but the Equity call levels are not yet at levels seen at INT tops. The closest similar top is June 2018, where the SPX saw a 100 pt pullback before further advance.

Conclusions. Most of the recent strength in the stock markets is in the large cap DJIA, led by the down-trodden Boeing playing catch up. Comparing to the Jan 2018 melt up, stocks seem to be at mid-Dec 2017, where a consolidation/pullback to reset bearish sentiment to neutral was seen before the final melt up. A longer topping period is still not out of the question.
Weekly Trade Alert. There is really no support for going long except opt exp week, and no reason to short in the short term. Updates @mrktsignals.
Investment Diary, Indicator Primer, update 2019.04.27 Stock Buybacks, update 2018.03.28 Dumb Money/Smart Money Indicators
Article Index 2019 by Topic
Article Index 2018 by Topic
Article Index 2017 by Topic
Article Index 2016 by Topic
Long term forecasts
© 2019 SentimentSignals.blogspot.com
No comments:
Post a Comment