
Black holes are seen as a source of infinite destruction as matter is sucked in under immense gravitational forces, as well as a source of infinite power, such as the potential to travel across immense distances at faster than the speed of light if a fraction of the power can be harnessed. The markets, especially precious metals, seem to be focused on the power potential, but my feeling is that the Fed may be just building a bigger roach motel.
I. Sentiment Indicators
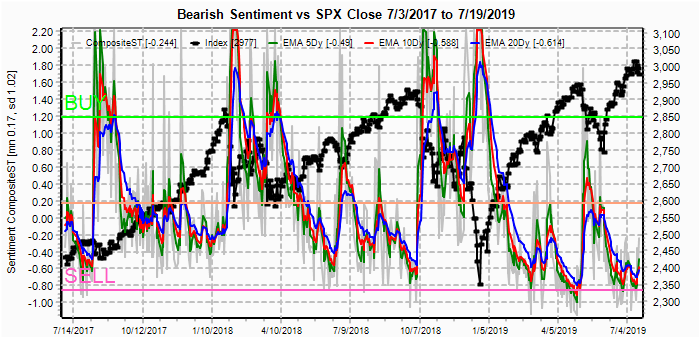
The overall Indicator Scoreboard (INT term, outlook two to four months) bearish sentiment has increased only slightly, but may be still comparable to Dec 2017 before the Jan 2018 melt up.

The INT view of the Short Term Indicator (VXX+VXXB $ volume and Smart Beta P/C [ETF Puts/Equity Calls], outlook two to four months) bearish sentiment has also seen a comparable move to Dec 2017.
Bonds (TNX) may be seeing a bottoming in interest rates with very low sentiment.

For the INT outlook with LT still negative, the gold miners (HUI) bearish sentiment has fallen off a cliff as prices have gone parabolic. This does not typically end well, as seen in the crypto market several years ago.

II. Dumb Money/Smart Money Indicators
For this week and possibly for the next several months, I am going to replace the DM/SM ETF indicators with other indicators.
The option-based Dumb Money/Smart Money Indicator as short/INT term (outlook 2 to 4 mns/weeks) saw a sharp rise back to the neutral level, so far matching Dec 2017.

And the sister options Hedge Ratio sentiment is sharply lagging as there is still little hedging support and probably indicates more downside in the future.

The INT term SPX Long Term (2x/DM) ETFs (outlook two to four weeks/mns) bearish sentiment is also relatively unchanged, and as more of an INT indicator contradicts the melt up scenario.

The INT term NDX Long Term (2x/DM) ETFs (outlook two to four weeks/mns) bearish sentiment also remains very low. Last weeks warning of lower bearishness than the SPX pointing to under performance proved correct as the NDX was down 2% vs 1% for the SPX. This week sentiment is similar, so performance is likely to be the same.

III. Options Open Interest
Using Wed close, remember that further out time frames are more likely to change over time, and that closing prices are more likely to be effected. This week I will look out thru Jul 26. Also, This week includes a look at the TLT thru Jun.
With Fri close at SPX 2977, Mon is slightly positive with strong support at 2950, but open int is small.

Wed is similar with a likely range of SPX 2880 to 3000.
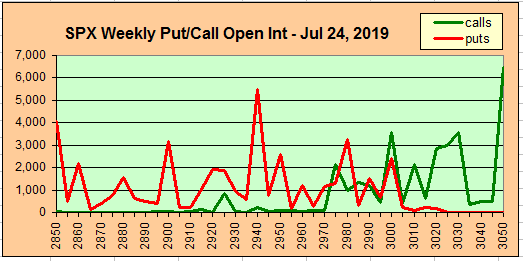
For Fri, the open int is large but there is much overlap between SPX 2925 and 3000. I calculated the wtd avg of puts that showed support at 2945 and call resistance at 2985, so 2950-80 is the most probable range.

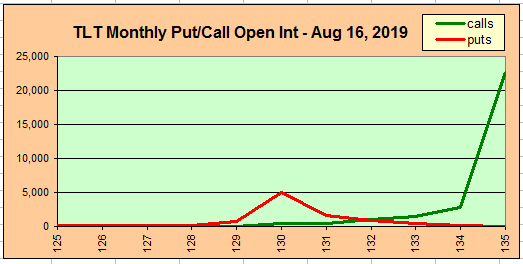
Currently the TLT is 131.7 with the TNX at 2.5%. Last weeks GDX showed little call resistance over 25 that may have contributed to the price run up, amd this week TLT is the opposite with very little put support if 130 is broken to the downside thru Aug 16.
IV. Technical / Other
I am still 50/50 regarding the melt up vs rounded top scenarios and this week I will look at a combination as a result of what appears to be an ending diagonal in the SPX with 3 waves complete. Here we could see a pullback to SPX 2850-2900 by early Sept, then a final rally into late Oct-mid Nov to 3050-3100.
The Smart Beta P/C components seem to bear this out as the 10 day SMA of Equity calls reached the same level as the Apr high with ETF puts almost matching the May lows.

Conclusions. Although I can't rule out Fed craziness as currently seen in the precious metals, the last two weeks showed strong pickups in the jobs report and the Philly ISM that may cause the Fed to disappoint. However, we have seen almost two years of disappointments with the China trade agreement and the markets don't seem to care. The scenario listed under Tech/Other seems most likely.
Weekly Trade Alert. More volatility but not strong bias is likely to present difficult trading. I am still completing my side projects, so hopefuly won't miss much. Updates @mrktsignals.
Investment Diary, Indicator Primer, update 2019.04.27 Stock Buybacks, update 2018.03.28 Dumb Money/Smart Money Indicators
Article Index 2019 by Topic
Article Index 2018 by Topic
Article Index 2017 by Topic
Article Index 2016 by Topic
Long term forecasts
© 2019 SentimentSignals.blogspot.com
This comment has been removed by the author.
ReplyDeleteBrilliant work as usual.
DeleteAfter the current 4th wave drop till 2945-50, S&P will again rise till about 3050 till the end of the month.
I have noticed that you frequently refer to EW counts of S&P. The hypothesis that S&P is making an Ending Diagonal is wrong. In reality, Primary Wave 3 finished at 2943 last year and currently, S&P is making an irregular flat in Primary wave 4. The rise till 3050 will finish the last sub-wave of the entire C wave from 2723.
The patter S&P is making is actually very bearish as C wave will fall considerable short of the length of the A wave.
From 3050, I am expecting an 800 pt drop till about 2200. Timeframe should be till February next year.
This will be followed by a monstrous rise, which will be quicker than the fall from 3050.
Thanks again for all your hard work. Hope this analysis helps with your EW inputs.
Ajay
Ajay, I think a lot of people use EW to some degree. But I've never found it to be accurate at predicting the future. Sometimes it works for short term moves from day to day but the big picture has too many unknowns.
ReplyDeleteFor example, this coming FOMC meeting on July 31st the market expects a 25 point cut minimum, maybe even 50 points. What if the Fed's don't cut at all? That will cause a large drop for sure. But if given what is expected the market will probably pullback small (because everyone is front running it) and then continue on up with the rally.
Then there's the Fed doing another round of QE in the possible future, which if they through more funny money in the market it will prevent any large moves down again. They are inflating this to the point that a full blown depression is possible but most likely it will just be a recession.
Oscar Carboini on YouTube gives 4 good reasons in a video he did as to why a recession is about 3 months away from starting. I can't put a link here but go to youtube and add this to the end. First put /watch? and then: v=VTEMzCh473g
The inverted yield curve he talks about is serious and happens at every recession, so odds are very strong he'll be right about this one too. We also have the political scene to worry about as if the people that control the stock market want Trump to get re-elected in 2020 then they will do whatever it takes to juice the market up next year.
That means more QE, lower interest rates, and whatever other hat tricks they can come up with. It won't likely work to start a new bull market but it should certainly keep the market going sideways in the recession... at least until the election is over with and then they can let it crash if they want.
Then there's the flip side of that coin, what if the people that control the market don't want Trump in for another 4 years? All they have to do then is to have the Fed NOT lower rates this coming July 31st, and NOT do any QE, and keep the current QT program going. The market will drop and will enter a recession for sure then.
Forecasting these things with EW is not possible I think, but if I were to count waves and look out to the future I'd go with Oscar's top in about 3 months and then a recession to start. So the top would be some large degree 5th wave up ending I'd say and then we'd have a large ABC decline for a couple of years.
There's many reasons here to expect a top in the market soon but the severity of the move down to follow might just boil down to what the Fed (or the people that control the Fed and the market secretly) do over the next year.
Raising rates, no QE, and continuing QT would be bad for Trump as a large drop would certainly happen going into the election next year, but after it's over with the next president would enjoy the large rally up from it and could take credit for it. Kinda like Clinton just happened to get in at the start of the 1992 bull market that topped out in 2000.
So far the controllers of the stock market seems to like Trump as they have done many good things the last 4 years to support him by keeping the market going up over all. But that could all be a ruse (trick) to replace him this coming election.
DeleteIt's war going on secretly between Trump and the elite pedophiles who are pushing their agenda hard on TV now with transgenders and under-aged sex. Jeffery Epstein is just one of thousands of creeps that should be thrown under the jail.
Not to get too deep into that but if they crash this market into 2020 then Trump has very little chance of winning. And if Oscar is right on his 4 reasons for a top in 3 months and a recession to start then Trump will have to work overtime to keep the market at least going sideways until the election is over with.
This is the biggest bubble in history as the Fed's couldn't do QE after cash for clunkers, after QE, and all the other schemes they've done from 2007-2009 recession back in the 1929 depression. Back then we were on the gold standard and could NOT just print up all the funny money we needed to inject into the stock market. This run up has been extreme and when it finally collapses America will be a different place for sure.
I hope they can pull a rabbit out of another hat and do a slow (10 years) decline so we won't enter a depression and will just have stagnation but no one knows the future. I sure don't. I just have to guess and try to win the next days trade. Whatever the future brings always remember that God is in control. Have a bless day and great comment.
Red
Reddragonleo,
DeleteI agree that EW has lot of uncertainties but only to certain extent. Once, the pattern is complete, nothing can change the outcome.
When Primary wave 3 finished at 2943 last year, I expected a big drop till 2200 but I completely failed to see the possibility of an irregular flat coming. SPX took 3 months to drop till 2300 and almost 7 months to get to 3050.
I am absolutely certain of my counts now and don't have an iota of doubt about the projected path.
3050 will certainly come and as I said in my previous post, irrespective of the fed outcome, we will see 2200 by next year March.
As far as fed rate cut is concerned, most probably there won't be any. Arthur had pointed out in one of his previous posts about inflation exceeding 2% so most probably fed won't cut rates.
Regarding the usefulness of EW, it is much better than forecasting long term rates than short term targets but hypothesis of ending diagonal is certainly wrong now that the wave structure is clear.
At 3050, we will get the short of our lives. Try it.