
I should have gone with my first instinct for my outlook for the SPX last week, as it was for a range of 2900-3000, but the put support at 2925 caused me to raise my targets. After Trumps tirade on Mon, threatening to block more tech purchases from the US by China and Tue news of additional measures to block the flow of US capital into China (their stock market is up 27% this year vs 16% for the US, so Trump has to do something about that), the net result was a weak start with the SPX, falling to 2985 before a 100 pt rally thru Fri that did close in the options OI target range of 2950-75. Overall, China trade negotiations came out exactly as expected with more of a detente/partial deal with negotiations to continue. As discussed by the HumbleStudent an HK native, the next flareup with China may be after the Hong Kong elections in Jan 2020 as China is unlikely to take military action as long as it hopes for favorable election results.
Not a lot of change in bearish sentiment for the week and the INT outlook remains slightly positive with a possible top for the SPX mid-2020 about 3100-50. The Tech/Other section will take a look at several of the data mining indicators this week. I am several months behind in indexing old posts and will try to catch up the next few weeks.
I. Sentiment Indicators
The overall Indicator Scoreboard (INT term, outlook two to four months) bearish sentiment has backed off its peak a week ago at levels between July 2018 and May 2019.

The INT view of the Short Term Indicator (VXX $ volume and Smart Beta P/C [ETF Puts/Equity Calls], outlook two to four months) bearish sentiment has remained below the levels of July 2018 and May 2019 indicating that higher volatility than seen off the two mentioned lows is expected.

Bonds (TNX) bearish sentiment took a nosedive last week to the lowest levels yet on mention of the Fed's QE-lite program. This time the purchases are to be from short term securities only that provide little support to longer term bonds. Purchase of a 6 month bond will also turn into QT 6 months later when the bond matures, so LT results are uncertain.

For the INT outlook with LT still negative, the gold miners (HUI) bearish sentiment is gradually increasing as prices fall, but the H&S still looks most likely.

II. Dumb Money/Smart Money Indicators
The option-based Dumb Money/Smart Money Indicator as short/INT term (outlook 2 to 4 mns/weeks) remains at fairly high levels and is starting to resemble the Mar 2018 period which supports a possible 6-8 month rally.

And the sister options Hedge Ratio sentiment is hovering near neutral that indicates higher levels of volatility are likely continue.

The Risk Aversion/Risk Preference Indicator (SPX 2x ETF sentiment/NDX ETF sentiment, outlook 2 to 4 mns/wks) as a INT indicator (pref to less risky SPX is bullish), has risen to levels consistent with INT lows for the SPX.

The INT term SPX Long Term/Short Term ETFs (outlook two to four wks/mns) bearish sentiment (2x DM/3x SM) has also risen sharply to levels similar to Mar 2018, also indicative of a multi-month (6-8 mos) rally.

The INT term SPX Long Term (2x/DM) ETFs (outlook two to four weeks) bearish sentiment is higher than at July 2018, but lower than May 2019 that may indicate a somewhat weaker rally pt-wise than seen off the Mar 2018 lows.

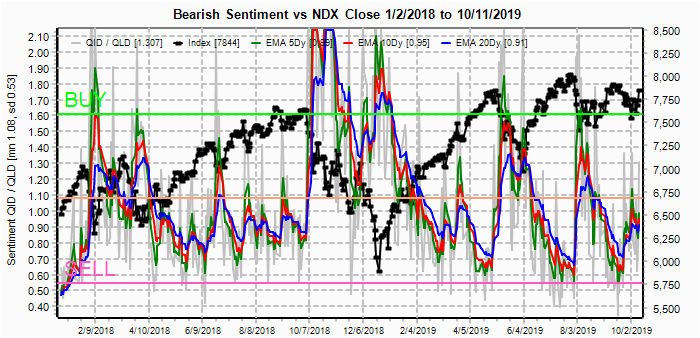
The INT term NDX Long Term (2x/DM) ETFs (outlook two to four weeks) bearish sentiment is also weak, indicating limited upside.
III. Options Open Interest
Using Wed close, remember that further out time frames are more likely to change over time, and that closing prices are more likely to be effected. This week I will look out thru Oct 16. Also, This week includes a look at the TLT for Oct.
With Fri close at SPX 2970, SPX put support is very light above 2910 with call resistance starting at 2975 and more significantly at 2990. There may be some follow thru buying by the public early to SPX 2990+, but will likely fade later during the day.

Wed shows very little put support until SPX 2885 with call resistance at 2050, 2975 and 3000. Likely there will be some lingering "sell the news" effects after Mon euphoria wears off. Light OI overall.

For Fri PMs, puts and calls overlap at 2925, 50 and 75, so that early week weaknees will likely increase support at these levels that will push prices back to the 2950-75 level. Otherwise major support and resistance at 2900 and 3000.

Currently the TLT is 140.4 with the TNX at 1.75%. Positions are largely the same as two weeks ago when I said that put support would likely keep the TLT above 140 and it did. The trade news could be a game changer as a move below 139 could setup negative delta hedging (put writer selling) and could drive prices down to the 136-7 area or lower.

IV. Technical / Other
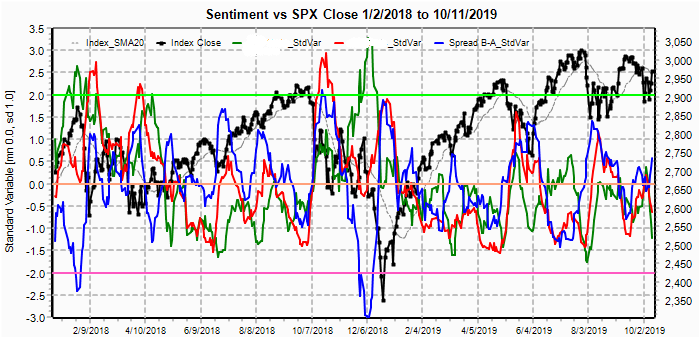
The first data mining variable I want to look at is the Smart Beta P/C spread. Although several "false" positives were seen, the spread neared -2 SD before each sharp drop since 2018. More noticeable is that a series of lower lows and highs were seen before the Oct 2018 top, while now we are seeing a series of higher lows and higher highs. Currently at neutral, there is no directional bias.

The options DM/SM and Hedge Ratio spread is showing a pattern of lower lows that may act as a LT indicator (purple line), thus indicating that an even larger decline than seen in Oct-Dec may be ahead due to low levels of hedging, but could be several months away.

Finally, the Crash Indicator Spread, where BUYs and SELLs are at +1 and -1 SD, and Crash signals are <= -2 SDs, is slightly positive at +.5 SD with a slight positive bias.
Conclusions. Overall, sentiment indicators show that a multi-month advance is likely, but a higher level of volatility and a smaller advance, point-wise, is to be expected. This is consistent with a a top mid-2020 in the range of SPX 3100-50. We may even see a repeat of the May top in 2015.
Weekly Trade Alert. SPX options OI indicates that early Mon may see a retest of the Fir highs at 2990+, but a pullback below 2950, possibly 2925 is likely by mid-week. EPS season begins next week with many of the large banks reporting early in the week. Low int rates have usually not been a positive, just look at Deutsche Bank AG's 75% drop since 2015, so banks may pull the SPX down. By Fri, however, a recovery to the 2950-75 level is expected. Updates @mrktsignals.
Investment Diary, Indicator Primer, update 2019.04.27 Stock Buybacks, update 2018.03.28 Dumb Money/Smart Money Indicators
Article Index 2019 by Topic
Article Index 2018 by Topic
Article Index 2017 by Topic
Article Index 2016 by Topic
Long term forecasts
© 2019 SentimentSignals.blogspot.com
No comments:
Post a Comment