
Sentiment, overall, seems to following patterns leading up to both the Jan 2018 melt up and the Oct 2018 top. This weeks time period will extend back to Oct 2017 for better comparison. If the result is the former, then the following correction may be sharp, such as a "sell the news" of a weak China trade deal followed by new highs mid to late 2020, while the latter could be the beginning of a multi-phase bear market. Only time and sentiment will tell. News is starting to surface of turmoil in the Chinese banking system that could lead to another global financial crisis.
I. Sentiment Indicators
The overall Indicator Scoreboard (INT term, outlook two to four months) bearish sentiment appears to be bottoming near the SELL region similar to Dec 2017 and Apr 2019, but the lower lows and lower highs seen over 2019 seem to imply that a larger correction than that seen in Q4 2018 is not that far away.

The INT view of the Short Term Indicator (VXX $ volume and Smart Beta P/C [ETF Puts/Equity Calls], outlook two to four months) bearish sentiment the pattern of lower sentiment highs and lows is even more evident in the ST indicator. The "curling up" of bearish sentiment is similar to mid-way in the Jan 2018 melt up.

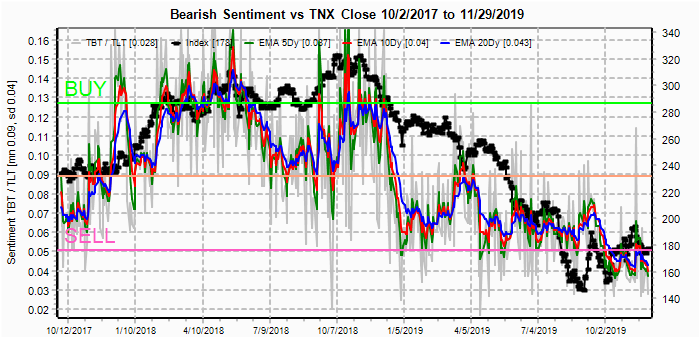
Bonds (TNX). Strong flows into long bond ETFs are keeping sentiment at low extremes.
For the INT outlook with LT still negative, the gold miners (HUI) bearish sentiment re,aons pinned to the SELL area.

II. Dumb Money/Smart Money Indicators
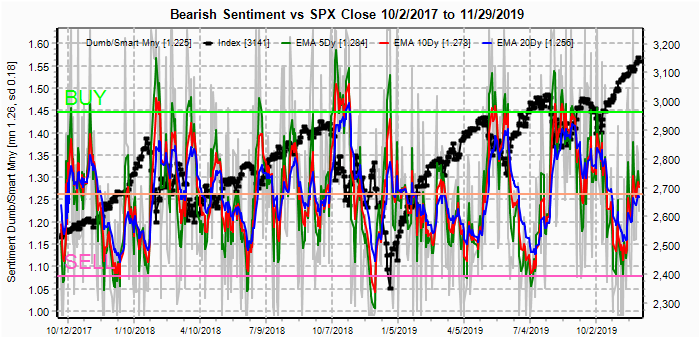
The option-based Dumb Money/Smart Money Indicator as short/INT term (outlook 2 to 4 mns/weeks) remains near the neutral area similar to late Dec 2017 and Sept 2018, and a decline is expected before a market top.
And the sister options Hedge Ratio sentiment has remained above neutral at somewhat higher levels than Dec 2017 and Sept 2018, but should also see a downturn before a market top.

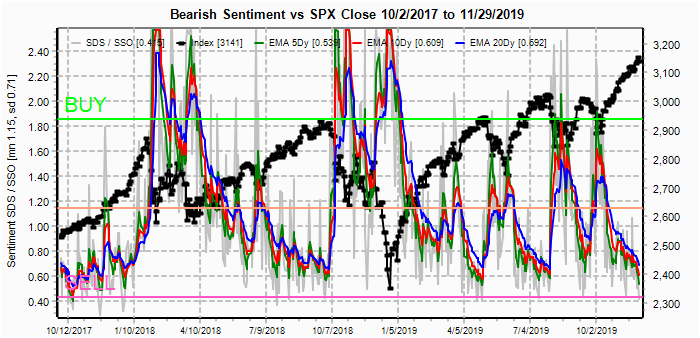
The INT term SPX Long Term/Short Term ETFs (outlook two to four wks/mns) bearish sentiment (2x DM/3x SM) saw a divergence from 2017-18 as a rising trend, that in retrospect was a indication of potential market strength, but the recent trend breakdown is now nearing levels seen at the Jan and Sept 2018 tops
.

The INT term SPX Long Term (2x/DM) ETFs (outlook two to four weeks) bearish sentiment saw a sharp break downward and is now at the levels of the Sept 2018 top.
The INT term NDX Long Term (2x/DM) ETFs (outlook two to four weeks) bearish sentiment remains near the Dec 2017 levels.

III. Options Open Interest
Using Wed close, remember that further out time frames are more likely to change over time, and that closing prices are more likely to be effected. This week I will look out thru Dec 6. Also, This week includes a look at the TLT Dec monthly.
Also this week I want to look at possible SPX hedge indicator that popped up from some data mining. Please note this not meant to be a general market indicator, but simply a measure of the reliability of the SPX support resistance zones. High hedging indicates more pressure to push up toward strong call resistance, while low hedging indicates more push toward strong put support. Last week showed strong call resistance at SPX 3100 and 3150. Since prices stayed above 3100, hedging pushed prices up to the 3150 area which held by the Fri close. The SPX hedge spread remains high similar to Sept 2018, a drop to neutral may signal a top is in place as in Oct 2018.

With Fri close at SPX 3141. Mon/Wed are unusual as both days show large OI. On Mon, strong call resistance is seen at 3160 and 3170 with little put support until 3100. SPX hedging is expected to push prices higher toward the 3160-70 area.

Wed again shows stron SPX call resistance at 3160 and 3170 with little put support until 3080. SPX hedging is likely to still support prices unless the hedge ratio falls dramatically.

For Fri, the outlook becomes much more interesting as strong call resistance exists, currently, between 3075 and 3170 with some overlapping put support between 3075 and 3125. Watch closely for twitter updates, as a decline in the SPX hedge ratio should lead to a drop to at least 3125.

Using the GDX as a gold miner proxy, last week showed a likely range around 26.5 thru Dec where resistance is now forming with the 50 and 100 SMAs at 27.15 and 27.75.
Currently the TLT is 140.4 with the TNX at 1.78%. SMA support for TLT is 140-139.3. For Dec 20, prices should stay between put support at 136 and call resistance at 140. Most likely close is 138 due to large overlaps of puts and calls or "max pain".

IV. Technical / Other - N/A
Conclusions. Last week may end up being a preview of the week ahead. Bearish sentiment is approaching rock bottom levels for most indicators, while several options (ST) related indicators show that hedging is still likely to support a higher SPX, at least thru Wed. SPX OI shows a strong resistance zone at 3160-70 thru Wed, while Fri shows the potential for a drop to 3125 or lower by Fri, assuming hedging subsides.
Weekly Trade Alert. Upside bias early in the week with the potential for Thur/Fri selloff of 1+%. Updates @mrktsignals.
Investment Diary, Indicator Primer, update 2019.04.27 Stock Buybacks, update 2018.03.28 Dumb Money/Smart Money Indicators
Article Index 2019 by Topic
Article Index 2018 by Topic
Article Index 2017 by Topic
Article Index 2016 by Topic
Long term forecasts
© 2019 SentimentSignals.blogspot.com
No comments:
Post a Comment