
Overall, bearish sentiment is approaching the area of an INT top, but still may be several weeks away from a significant downturn. This weeks Tech/Other section looks at the Crash Indicator and VIX options that show no immediate warning of a pickup in volatility.
I. Sentiment Indicators
The overall Indicator Scoreboard (INT term, outlook two to four months) bearish sentiment continues to gradually decline, now reaching the level of the Aug 2019 and Sept 2018 tops, but an INT downturn is likely to see several weeks of extremes before a major turn.

The INT view of the Short Term Indicator (VXX $ volume and Smart Beta P/C [ETF Puts/Equity Calls], outlook two to four months) bearish sentiment has reached the extremes of the Apr and Aug 2019 tops.

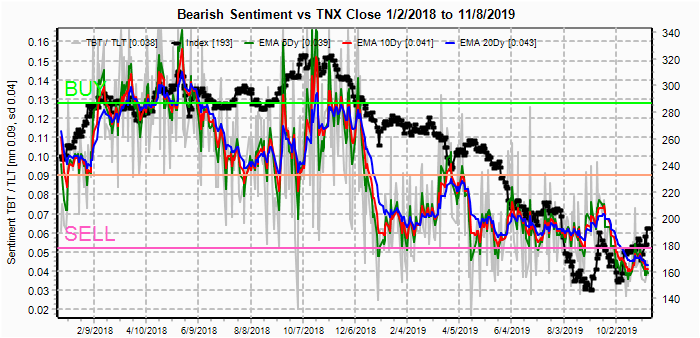
Bonds (TNX). Interest rates broke upward sharply last week as indicated by the bank stock index breakout, but surprisingly bearish sentiment fell as investors saw this as a buying opportunity.
For the INT outlook with LT still negative, the gold miners (HUI) bearish sentiment took an even sharper drop as the HUI held above the 200 level while gold fell from the 1530s to the 1450s. It's interesting that the TNX is hovering below 2.0% as the HUI hangs in over 200, will it require a TNX over 2.0% for the HUI to break 200?

II. Dumb Money/Smart Money Indicators
The option-based Dumb Money/Smart Money Indicator as short/INT term (outlook 2 to 4 mns/weeks) has reached the level wjere a top could occur at anytime, but compared to Apr and Aug tops, lower levels or more time is likely before a market downturn.

And the sister options Hedge Ratio sentiment is still showing moderate levels of hedging that may prevent an immediate downturn or limit downside such as in Jun 2018.


The INT term SPX Long Term (2x/DM) ETFs (outlook two to four weeks) bearish sentiment continues to gradually fall, now also approaching the Aug 2018 level.

The INT term NDX Long Term (2x/DM) ETFs (outlook two to four weeks) bearish sentiment remains very low. but not as extreme as Jan 2018.

III. Options Open Interest
Using Wed close, remember that further out time frames are more likely to change over time, and that closing prices are more likely to be effected. This week I will look out thru Nov 15. Also, This week includes a look at the TLT.
With Fri close at SPX 3093, faces moderate call resistance at 3100, which held last week, with little put support until 3050. Barring unforeseen news events over the weekend 3075-3100 is the likely range.

Wed shows fairly large call OI that may turn out to be resistance if the SPX shows weakness. Wed is scheduled to start the public airing of the House impeachment hearings and there is a good possibility that uncertainty will push prices down to the 3050 (put support) to 3080 range.

For Fri, OI shows the most optimistic (bearish) setups I've seen in quite a while. Call positions are very large, especially for SPX PMs and there is virtually no put support all the way down to 3000, while call resistance over 3100 is huge. This may not be result in a large decline, but weakness Wed could spell big trouble by Fri close.

Currently the TLT (not TJT) is 135 with the TNX at 1.93%. The push thru huge put resistance at 137 and 135 does not bode well for bond bulls, but any weakness in the SPX may provide temporary support. A push below 135 could result in negative delta hedging with next support at 131.

IV. Technical / Other
The Crash Indicator fell sharply early in the week, but then stabilized just short of the warning level of -1 SD about the same as in Sept.

Using the volatility measures for SKEW, VIX calls and VIX puts compared to the overall options sentiment, CPC revised. The INT SKEW indicator has now reached the level seen in Mar 2018 and Apr 2019 before SPX 200 pt drops.

But the ST VIX options indicators are near neutral. Chart 1 is calls and chart 2 is puts.


Conclusions. Most of the INT indicators are showing that a downturn is approaching, but the options Hedge Ratio and LT/ST SPX ETF indicator are showing more time is needed before a downturn. The VIX options indicators show no warning of an immediate pickup in volatility. The overall outlook simliar to Nov-Dec 2015 is still viable, but so is a slow melt up, and either way, a top around mid Dec with a Jan-Feb decline to SPX 2950 or lower seems likely.
For options OI, the SPX held over the 3050 area early in the week with Mon gap up to 3080 where there was little resistance, resulting in positive delta hedging the rest of the week. GDX showed stiff resistance at $28.5, and ended up falling from $28 to 26.2 near the $26 resistance.
Weekly Trade Alert. The wildcard this week is the House impeachment hearings, scheduled to go public on Wed. SPX options OI shows the potential for some downside volatility, but surprisingly the VIX options are mostly neutral. SPX 3100 is going to be hard to beat by mid week and currently a slow fade the next couple weeks toward 3000-50 seems likely. Updates @mrktsignals.
Investment Diary, Indicator Primer, update 2019.04.27 Stock Buybacks, update 2018.03.28 Dumb Money/Smart Money Indicators
Article Index 2019 by Topic
Article Index 2018 by Topic
Article Index 2017 by Topic
Article Index 2016 by Topic
Long term forecasts
© 2019 SentimentSignals.blogspot.com
No comments:
Post a Comment