
The volatility spike in last weeks "mini flash crash" could be compared to that of Mar 2015 and Aug 2017. Both turned out to be "bear traps" where the SPX went on to make an INT top, two months later for 2015 (May) and five months later (Jan) for 2017. Interestingly, both saw a sharper decline of 10%+ five months later in Aug 2015 and Jan-Feb 2018. If history repeats, May of 2020 would be the timing target to start the next decline of 10%+.
Below is a chart of SPX 2015. The circled area shows Mar 2015 where the 3% three decline was part of an overall 5% decline where a rally retraced all but a few pts of the entire decline in about the same amount of time as the decline. What followed next was a higher retest of the lows that in today's market would be a gap fill at SPX 3093. Will history repeat?

I. Sentiment Indicators
The overall Indicator Scoreboard (INT term, outlook two to four months) bearish sentiment showed only a weak reaction to last weeks early decline and does not support a very strong rally from here.

The INT view of the Short Term Indicator (VXX $ volume and Smart Beta P/C [ETF Puts/Equity Calls], outlook two to four months) bearish sentiment also only showed a small blip upward.
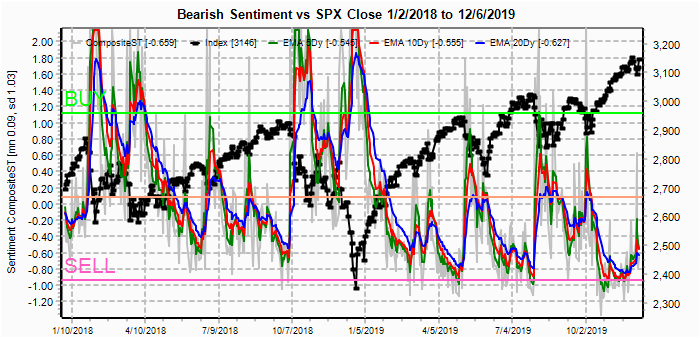
Bonds (TNX) bearish sentiment continued to fall last week although rates were mostly unchanged to higher for the week as investors seem to be fleeing the volatility of the stock market.

For the INT outlook with LT still negative, the gold miners (HUI) bearish sentiment remain mostly unchanged as were prices for the week.

II. Dumb Money/Smart Money Indicators
The option-based Dumb Money/Smart Money Indicator as short/INT term (outlook 2 to 4 mns/weeks) only showed a slight pickup in bearish sentiment somewhat similar to the pullback after the Sept 2018 top.

And the sister options Hedge Ratio sentiment is also in a similar position to the pullback after the Sept 2018 top..

The INT term SPX Long Term (2x/DM) ETFs (outlook two to four weeks) bearish sentiment remains in a downtrend similar to July of 2018.

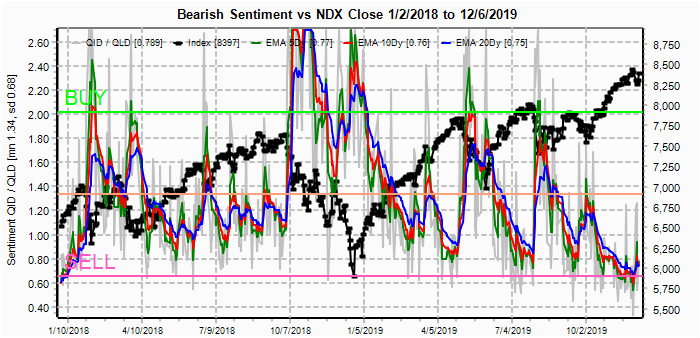
The INT term NDX Long Term (2x/DM) ETFs (outlook two to four weeks) bearish sentiment still shows the least bearish sentiment since 2017 and should cause under performance for the NDX.
III. Options Open Interest
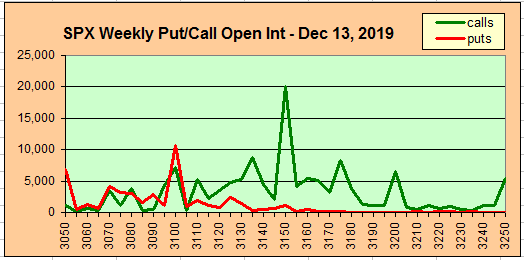
Using Thur closing OI, remember that further out time frames are more likely to change over time, and that closing prices are more likely to be effected. This week I will look out thru Dec 13. Also, This week includes a look at the GDX for Dec 20.
With Fri close at SPX 3146, down 8 pts for the week. Last Mon/Wed showed strong call resistance at 3170-80 and put support at 3080, but I expected hedge support to hold prices up thru mid-week and instead, courtesy of Tweeter in Chief and Mon's weak PMI, weakness was shown early with hedging pulling prices up at the end of week. This Mon, we see moderate call resistance at SPX 3150 and below that could pressure prices toward the 3110 area.

Wed also shows moderate call resistance at 3150 and not much put support until 3100 the 3050.

For Fri, we see more of the same. As with Mon/Wed, as long as SPX prices remain below 3150, calls should pressure prices toward the 3100 put support area. This lines up with the 2015 type retrace to the 3090 gap area, possibly starting early next week.
Currently the GDX is at $27 and is expected to stay in the range of 26-28.

IV. Technical / Other - N/A
Conclusions. It is somewhat amazing that after 12 months, the SPX remains in a similar price pattern to the rally off the Oct 2014 lows, even though the timeline is much more elongated (at a little over 2x). Last weeks volatility event lines up well with both the Mar 2015 and Aug declines which were followed 5 months later by a 10%+ decline after new ATHs. Applying alternation, my best guess is still the rounded top scenario from 2015 where stocks may put in a top with the 2019 Q4 earnings reports Jan-Feb 2020. The Trump impeachment proceedings may then have a stronger effect on the markets as most are dismissing any serious consequences due to a GOP controlled Senate, but if the proceedings stretch out more than a couple of months, more serious consequences become more likely. A Trump resignation, putting Pence in charge well before the election could be used as a face saving outcome for the GOP, but could result in a Aug 2015 type stock melt down.
Weekly Trade Alert. Whipsaws like we saw last week make it almost impossible to have any confidence in a prediction, but the most likely pattern seems to be a pullback to retest the lows around SPX 3090. FOMC on the 10-11th may provide an excuse for a selloff since some seem to be expecting another rate cut. Could we see a "turnaround Tuesday" optn exp week? Updates @mrktsignals.
Investment Diary, Indicator Primer, update 2019.04.27 Stock Buybacks, update 2018.03.28 Dumb Money/Smart Money Indicators
Article Index 2019 by Topic
Article Index 2018 by Topic
Article Index 2017 by Topic
Article Index 2016 by Topic
Long term forecasts
© 2019 SentimentSignals.blogspot.com
It sure seems like the market is defying gravity Arthur. It should have sold off a lot more then what it has this year. It's like they are doing everything possible to hold it together until after the 2020 election. The QE4 money (or REPO... whatever you want to call it?) is massive when compared to QE1, 2 or 3... yet they can't seem to get the market to gain that much in percentage terms.
ReplyDeleteThey certainly can't get a new bull market going. Like you said, a rounded top seems likely, but only as long as they keep dropping helicopter money (which I'm sure it won't ever stop until they are ready to let it crash). Looks like it's going to be a sideways swing trading market then until the middle of next year.
I'm surprised with your thoughts on Trump stepping down and let Mike Pence become the president? I don't see where Trump has done anything wrong to get impeached. He's not a saint but he's no where near as dirty as Bill Clinton was, or Obama... and idiot Bush. The dirtiest of all of them was George Walker Bush in my opinion. Carter was a simple man that I think was mostly a honest man... just peanut farmer.
Kennedy was a ladies man like Clinton but ten times better of a man, which is why they killed him I guess? It seems that the good presidents are always targets of assassination (Reagan was shot, but lived), as I think Lincoln was a great man too. Dirty presidents get noble prize awards and millions of dollars in kickbacks from criminal elites. Good ones get attacked with impeachment or assassination.
Thanks as always for taking the time to do such through weekly updates.