
My conclusion based on other sentiment measures is that we may be a couple of weeks away from a top in the SPX, but that there could still be several months before the beginning of a sharp downturn (similar to the rounded top of May 2015). As summarized by ZeroHedge, "the bears have left the building".
I. Sentiment Indicators
The overall Indicator Scoreboard (INT term, outlook two to four months) bearish sentiment ST (grn) last week dropped to the lowest level seen in the past two years with the LT (blu) right behind. Don't be surprised to see a 1-3% pullback before EOY with likely higher highs early Jan.

The INT view of the Short Term Indicator (VXX $ volume and Smart Beta P/C [ETF Puts/Equity Calls], outlook two to four months) bearish sentiment has also turned back down.

Bonds (TNX). Interest rates moved somewhat higher last week from TNX 1.85 to 1.92% after a test of 1.95%. The 200 SMA may act as resistance at 2%. The Safety Trade Indicator (SPX/TNX) proved correct as both SPX and int rates moved higher. Interestingly Avi Gilbert on Mon forecast a sharp drop in rates with the TLT testing its highs at 151, however, support at 136 was tested twice and if it fails his forecast is 125 or TNX 2.3-2.4%.

For the INT outlook with LT still negative, the gold miners (HUI) bearish sentiment saw a sharp drop at the end of the week while prices consolidated around 220 for no apparent reason.

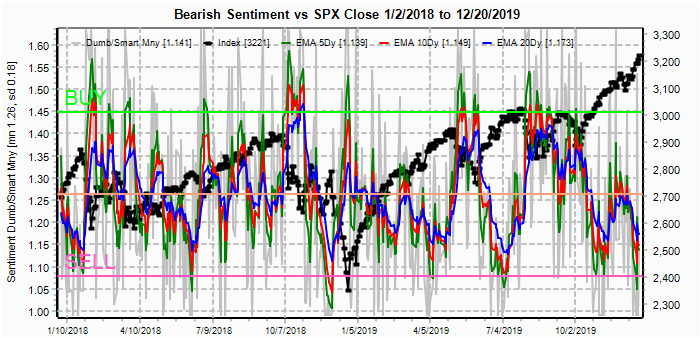
II. Dumb Money/Smart Money Indicators
The option-based Dumb Money/Smart Money Indicator as short/INT term (outlook 2 to 4 mns/weeks) is quickly approaching its lowest level of the last two years with a ST spike similar to June 2018 that may mean a quick pullback, while higher SPX may produce sentiment similar to Dec 2018.
And the sister options Hedge Ratio sentiment is still not at extremes seen before crashes as in Jan and Dec 2018, but would allow a sizable pullback at any time.

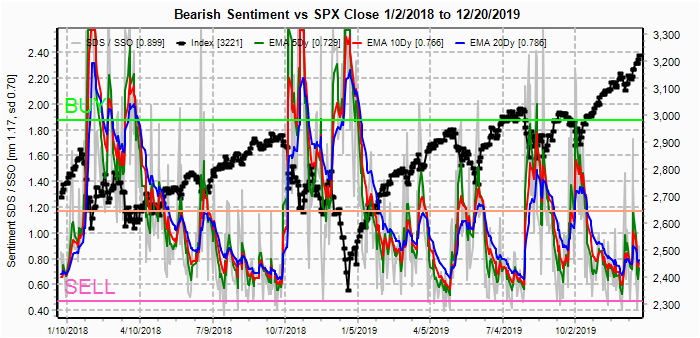
The INT term SPX Long Term/Short Term ETFs (outlook two to four wks/mns) bearish sentiment (2x DM/3x SM) is continuing to decline sharply as the Smart money correctly anticipated the moves off the Dec 2018 and Oct 2019 lows, but sentiment has moved to a level comparable to the Jan 2018 highs..

The INT term SPX Long Term (2x/DM) ETFs (outlook two to four weeks) bearish sentiment continues to show a rounded bottom as seen in Jan 2018.
The INT term NDX Long Term (2x/DM) ETFs (outlook two to four weeks) bearish sentiment also continues to show the rounded bottom as in Jan 2018.

III. Options Open Interest
Using Thur closing OI, remember that further out time frames are more likely to change over time, and that closing prices are more likely to be effected. This week I will look out thru Dec 27. With Wed a Xmas holiday and Tue a half day, Wed optns are moved to Tue. Also, this week includes a look at the TLT for Jan.
With Fri close at SPX 3221, the options setup for the week is much like last week where Mon shows little call resistance at higher prices with stronger resistance later in the week. The main difference is that overall sentiment is much more negative and any weakness early in the week will likely be amplified later in the week.

Tue strong call resistance at SPX 3225 is likely stop any rally if prices can't move higher on Mon. A drop to SPX 3200 or lower is possible.

For Fri, the large "strangle" at SPX 3200 may keep prices around that level, but weakness could prices as low as 3150.

Currently the TLT is 136.6 with the TNX at 1.92%. For Jan 17, put support should lift prices toward the 140 level that may indicate some weakness in stocks. I do not expect much fireworks in bonds until the second half of 2020.

IV. Technical / Other
First the Rydex Bear/Bull ETF Ratio, which I have indicated several times as an excellent INT indicator for the last rwo years, has reached the SELL level of 7.5% with a lead time of two to four weeks. However, there is no way to tell if an INT top is imminent as in Jan 2018 or if a more complex topping pattern will occur as in Jul-Oct 2018.

Looking at the volatility measures, SKEW and VIX options relative to CPC Revised, does appear to indicate a more prolonged topping pattern is likely. This time I am starting in Jan 2018, but realize that VIX call levels are unlikely to match the Jan/Feb levels due to the blowup of short vol accts (incl optn writers). First, the SKEW has recently risen dramatically, but remained high for several months before the Oct-Dec 2018 selloff. Given the overall low bearish sentiment (CPC Revised), the likely cause is smart money accumulating OTM puts.

Next the last time the level of VIX put buying with SPX at a high matched today's level was Jan 2018. If you remember the VIX actually rose even as the SPX moved higher. It's doubtful the VIX moves much lower unless VIX put buying drops.

The one element that is still missing for an imminent sharp decline is VIX call buying. This chart is distorted due to the Jan/Feb 2018 extremes, but I do expect something more like the Set-Oct 2018 levels before an INT decline (-1.5 SD vs now -.5 SD).

Conclusions. Extremely low bearish sentiment in most of the indicators indicate that a top may occur at any time, and options are still the Jan-Feb sharp pullback and rally into the election or a rounded top that may extend into mid-year. The choice of top may become clearer when the impeachment proceedings begin in Jan. I think too much is being read into the delay in passing the decision to the Senate, as the most likely reason is to give everyone a two week break for Xmas. A rounded top will probably be accompanied with an increase in volatility due to the high VIX put volume, but likely keep the SPX above 3000.
Weekly Trade Alert. The next two weeks may be the best chance the bears have had for a few weeks, but don't expect more than a 1-3% pullback. Updates @mrktsignals.
Investment Diary, Indicator Primer, update 2019.04.27 Stock Buybacks, update 2018.03.28 Dumb Money/Smart Money Indicators
Article Index 2019 by Topic
Article Index 2018 by Topic
Article Index 2017 by Topic
Article Index 2016 by Topic
Long term forecasts
© 2019 SentimentSignals.blogspot.com
No comments:
Post a Comment