
The more I think about it, I see Trump as the modern day version of Marlon Brando's Ugly American where showing a little respect would be a lot more productive than unlimited arrogance. If China has any sense, they should just walk away and let the US markets crash, but it would probably be a good idea to stretch it out to the 2020 elections to make sure Trump is booted out.
I have a few extra charts this week in the Tech/Other section, so I am going to do minimal discussion and let the charts do the talking.
I. Sentiment Indicators
The overall Indicator Scoreboard (INT term, outlook two to four months) bearish sentiment.
increased sharply last week that may support a ST rally, but longer EMAs do not show INT support.
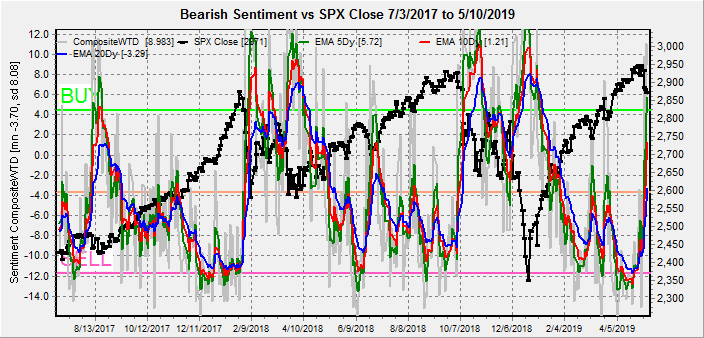
The INT view of the Short Term Indicator (VXX+VXXB $ volume and Smart Beta P/C, outlook two to four months) bearish sentiment rose moderately indicating that volatility is not likely to go away any time soon.

Bonds (TNX). Interest rates saw a mild pullback, but there was little change in sentiment.

For the INT outlook with LT still negative, the gold miners (HUI) LT bearish sentiment seems to finally catching up with the miners as prices bounced briefly to start the week then continued to fall. Bearish sentiment fell as well.

II. Dumb Money/Smart Money Indicators
For this week and possibly for the next several months, I am going to replace the DM/SM ETF indicators with other indicators.
The option-based Dumb Money/Smart Money Indicator as short/INT term (outlook 2 to 4 mns/weeks) rose sharply, matching the Jul 2018 lows. A rally for optn exp week seems likely.

And the sister options Hedge Ratio sentiment has lagged behind indicating that a rally at this point is likely to be short lived..

The INT term SPX Long Term (2x/DM) ETFs (outlook two to four weeks) bearish sentiment has risen only modestly and is short of the Jul 2018 levels.

The INT term NDX Long Term (2x/DM) ETFs (outlook two to four weeks) bearish sentiment has risen above the levels of Jul 2018, so the NDX should outperform.

III. Options Open Interest
Using Wed close, remember that further out time frames are more likely to change over time, and that closing prices are more likely to be effected. This week I will look out thru May 17.
With Fri close at SPX 2881. Light int overall with put support at 2875 and call resistance at 2915. Weakness to start the day is possible to 2850, but a close at/over 2875 is likely.

Wed shows very little bias between 2875 and 2925 but will likely change during the week.

For Fri, optn exp with large open int shows put support up to 2900 with call resistance at 2925. A move to 2920 is possible as shown in the Tech/Other section.

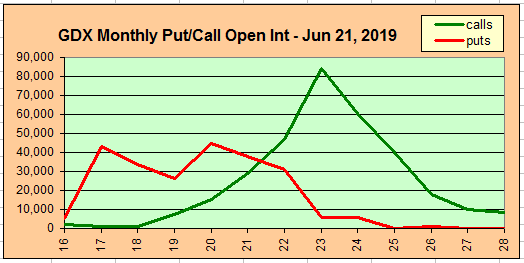
This week I am going to look at both TLT and GDX for Jun 21. Using the GDX as a gold miner proxy. For Jun optn exp, currently at 20.3, the Jun target is 20-21.
The TLT 20 year bond fund is used as a proxy for interest rates. For the last several years when the TNX was 112 when the TNX was 3.2% (11/2018), the TLT was 124 when the TNX was 2.5% (12/2017), and the TLT was 140 when the TNX was 1.5% (08/2016).
Currently the TLT is 124.7 with the TNX at 2.55%. Last weeks update predicted a weekly close of 124+, and the high for the week was 125. For Jun 21, put support should keep prices near 123.

IV. Technical / Other
During the course of setting up the "new" VIX Call indicator a few weeks ago, I set up an export of my DB to a CSV format for import into Excel, so now I can "data mine" the entire DB. This week I will show puts and calls for the VIX and SPX.
VIX calls (smart money) saw a sharp increase over 50% of the mean similar to Nov 2017 and Aug 2018, where both were followed to rally tops 2 months later.

While VIX puts (dumb money) rose even sharper, up over 78% of the mean, and in between the Jun and Oct selloff lows.

SPX calls have remained very subdued, supporting the low bullish interest shown in last weeks Rydex bull fund. Notice the run ups prior to the 2018 Jan, Mar and Sept tops

While SPX puts saw a sharp rise in a down market as seen in Mar and Oct 2018.

Additionally for EW counters, the SPX decline so far looks like an expanding diagonal with 3 waves so far that may rally back to the low 2900s next week in agreement with the options OI. The hourly MACDs are extremely oversold.

Conclusions. Overall sentiment supports a ST rally back to the SPX 2900s, but not likely a LT bottom. China trade talks are likely to dominate the markets over the next few weeks. A new high at SPX 3000+ is possible with positive trade results, but I rate this at 40% and it would be a "sell the news" rally. A couple of years ago I did a sentiment analysis of the 2007-09 period and found that bearish sentiment was lowest in May 2018 after a partial retrace of the Lehman selloff. We could see something similar with stalled trade talks leading to a stair step decline into the Fall to SPX 2400-500. At that point the Fed may try QE-lite as discussed last week by buying 1-2 yr T-bonds that then leads to a rally back to SPX 2850+. If sentiment becomes bullish enough, a decline into the election is possible if worries over a Trump re-election surface.
Weekly Trade Alert. Mon may start the week weak to SPX 2850-75, but an opt exp week rally to about 2920 is likely. Updates @mrktsignals.
Investment Diary, Indicator Primer, update 2019.04.27 Stock Buybacks, update 2018.03.28 Dumb Money/Smart Money Indicators
Article Index 2019 by Topic
Article Index 2018 by Topic
Article Index 2017 by Topic
Article Index 2016 by Topic
Long term forecasts
© 2019 SentimentSignals.blogspot.com
Another good update Arthur. Thanks for your hard work.
ReplyDelete